 |
Classic sounding capabilities
You've learned to love sounding analysis programs like older RAOB
versions and SHARP. However, no longer are you stuck with MS-DOS. You
can get these powerful capabilities in Windows, with all the benefits
they provide, such as printing, export, and clipboard capabilities! |
 |
Emagrams and tephigrams too!
We haven't forgotten our users in Europe and elsewhere around the world,
who are well-acquainted with tephigrams and emagrams. Choosing a style
is as simple as ticking off an option in the configuration panel. |
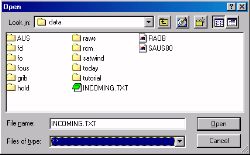 |
Importing a file
It's easy to import a file. All you have to do is choose the filename.
In this case, we're looking inside the Digital Atmosphere directory,
where some upper air data has been imported already by Digital
Atmosphere. |
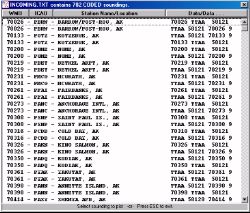 |
Sounding list
When you've imported a large file with soundings, you'll need to choose
which one you want to see. It's easy to do with this selection box. |
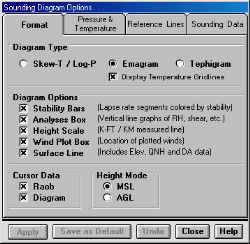 |
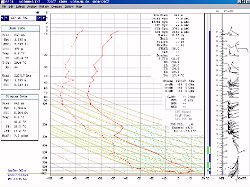
Diagram formats
You get complete control over how you want the sounding diagram to look.
Do you like SKEW-T's, emagrams, or tephigrams? Do you want height
scales? Wind barbs? And how do you want heights displayed -- AGL or MSL? |
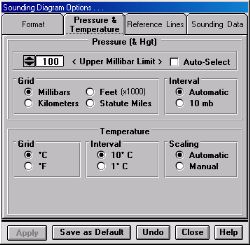 |
Pressure and temperature
options
This panel allows you to choose how high you want the top of the
sounding to be -- excellent for getting a closer look at convective
instability. You can even choose the background grid to be height
instead of pressure! The temperature grid settings allow you to tighten
the look of the temperature scales for exacting manual analysis.
|
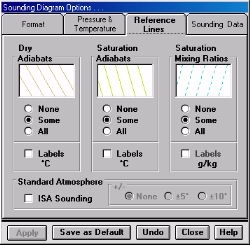 |
Reference lines options
The Reference Lines settings panel allows you to choose colors,
intervals, and labels for the adiabats and mixing ratio lines. |
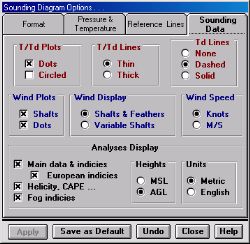 |
Sounding data options
The question is: do you like data plots defined with dots or circles?
How about some more questions? Do you like the sounding trace plotted
with thin or thick lines? Do you want the wind plots to look like
standard barbs or more like vectors? There's a whole lot to choose from
here. |
 |
Display preferences
Here is where Australian, Brazilian, South African, and other southern
hemisphere users can configure the wind barbs to display appropriately
for their region. There's also a few other options that will help tidy
up the charts to one's liking. |
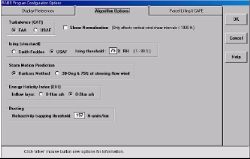 |
Algorithm options
In the Algorithm Options menu, you can take control over how the
turbulence, icing, storm motion, energy-helicity index (EHI), ducting,
and shear values are calculated. For example, you can use the FAA or Air
Force method of computing clear-air turbulence. For the EHI values you
can pick the lowest 1 km or lowest 2 km of SRH values. |
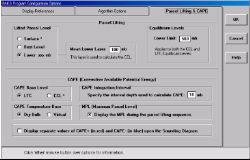 |
Parcel lifting & CAPE
Storm chasers and severe weather forecasters will love this control
panel. You get one of the most important controls for computing parcel
lifts: the lift method. This allows you to choose which type of CAPE
gets displayed: SBCAPE, MUCAPE, and MLCAPE. There are other parcel lift
parameters you can set to get that perfect convective analysis. |
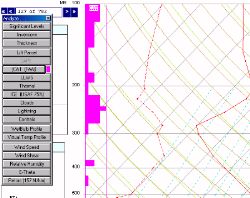 |
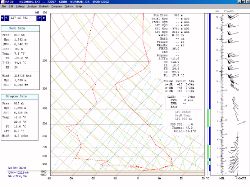
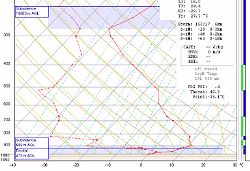
Analysis toolbox
A convenient toolbox allows you to choose between many options that will
be evaluated vertically and displayed on the chart. For instance here
we've clicked the clear-air turbulence button. The result is a pink
graph showing the levels where turbulence is most likely, based on shear
algorithms calculated by RAOB. |
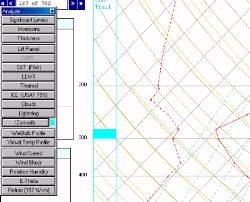 |
More toolbox selections
This is another analysis, this time of contrails. By clicking this
button, RAOB evaluates the sounding to see where temperatures and
humidity exceeds a certain threshold. The result is plotted on the chart
in cyan. This indicates jet contrails are likely to form around the 300
mb level. |
 |
Inversion analyses
RAOB evaluates the atmosphere to find temperature inversions, then
determines whether they are subsidence, frontal, or radiation along with
their heights above ground level. A handy tool for aviation forecasters! |
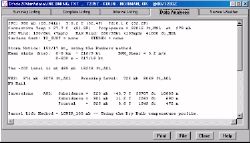 |
Sounding analysis summaries
You can pop up a summary window that lists all of the analyzed
information about the sounding, including inversion data, convective
parameters, thermal indices, and so forth. This can be exported,
printed, or cut & pasted! |
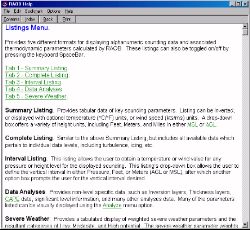 |
Online help
Finally the program contains the all-important online help, accessible
simply by clicking Help or pressing F1. This is where you'll get
complete instructions on how to use the program. If you're really stuck,
free technical support is available. |


