|
OriginPro offers
all of the features of Origin plus extended analysis tools in the
following areas:
Peak Fitting
The Peak
Analyzer tool in
OriginPro provides the additional capability of finding and fitting
multiple peaks in your spectra. Baseline anchor points can be
customized and fit with a suitable fitting function, and the
baseline fitting can be included as part of the final peak fitting
process. A detailed Fit Control dialog is provided to control all
aspects of peak fitting including mixed peak functions, peak centers
and widths, sharing parameters, and imposing bounds and linear
constraints on parameters. Graphical as well as tabular results are
generated as part of the final fit report.
Surface Fitting
OriginPro can fit a 3D surface to XYZ data points. The surface and
data points can be displayed together, including droplines from the
points to the surface.
Statistics
OriginPro expands on the statistical analysis capabilities of Origin
by providing additional tools for Descriptive
Statistics, Discrete Frequency Counting, Normality Tests,
Correlation Analysis, One-way and Two-way Repeated
Measures ANOVA, Principal
Component Analysis, Hierarchical Cluster and Discriminant
Analysis, manyNonparametric
Tests such as
Friedman ANOVA and Two-Sample Kolmogorov-Smirnov Test and
Mann-Whitney Test, Survival
Analysis tools
including Weibull Fit and Cox Proportional Hazard Model, ROC
Curves, and Power
and Sample Size Tests.
Signal Processing
Advanced signal processing features in OriginPro include Short-Time
FFT (STFT), Hilbert
Transform, Coherence, 2D
FFT and 2D
FFT-based Filtering, 2D
Correlation, andWavelet
analysis.
Gadgets
Gadgets provide a quick and easy way to perform exploratory analysis
on data plotted in a graph. OriginPro provides two additional
gadgets: Cluster and Rise
Time.
Image Processing
OriginPro offers more ways to handle your image data, including
alpha blending, pixel logic, morphological filtering, and
interpolated background subtraction.
|

Peak Analysis:
Multi-Peak Fitting with Residuals
Automatically find multiple peaks
and deconvolute overlapping peaks

3D Curve Fitting:
Surface Fitting with Droplines
Apply transparency to the fit
surface to
better see the relationship between the
fit and the data

Statistics: Survival
Analysis
Choose from three widely-used
survival
function models: Kaplan-Meier, Cox,
or Weibull

Signal Processing: Short-Time
FFT
Visualize the frequency
distribution of
time variant signals
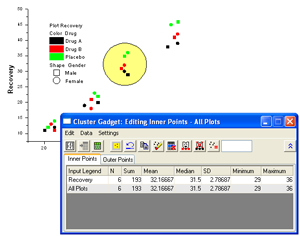
Gadget: Cluster
Gadget
The Cluster Gadget performs
simple statistics
on a region of interest (ROI) in a graph. |


