Snap a pivoting data screen into Microsoft Visual Studio
LightSwitch and instantly get in-depth business intelligence (BI) functionality
with ComponentOne OLAP™ for LightSwitch. Create interactive views and reports
similar to those found in Microsoft Excel Pivot tables and charts. Drag-and-drop
interaction gives you real-time information, insights, and results in seconds.
All this without cubes or code!
[Overview]
Below are the highlights, see the full feature list for more
information.
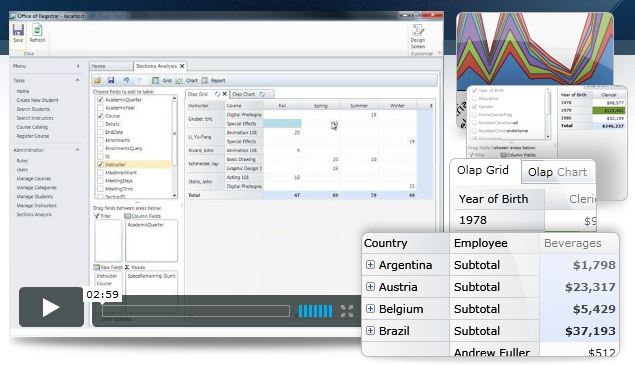
 OLAP Screen
OLAP for LightSwitch will add a complete screen to LightSwitch's "Add New
Screen" window. All you need to do is select it, name it, and choose data. You
will get an interface that includes a control panel, toolbar, and two tabs
congaing a pivoting grid and chart.
 OLAP Panel
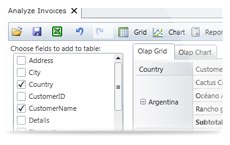
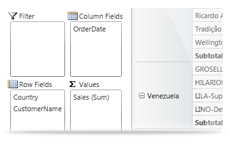
Use a drag-and-drop interface for defining and changing views. Since this is
very similar to the Microsoft Excel Pivot table interface, you will have no
trouble using it.
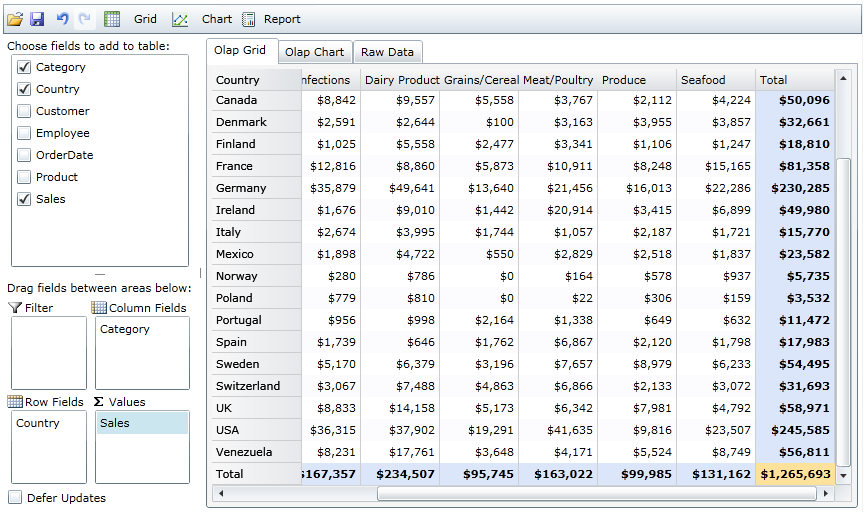
 Pivoting Grid
Use the drag-and-drop panel to define a pivoting table. Add analysis features
such as subtotals and grand totals, conditional formatting, drill-down data,
grouping and filtering. Reporting features such as printing, clipboard
functions, and export to CSV, HTML, or TXT make it a complete BI tool.
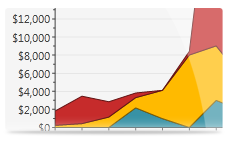 Pivoting Chart
The panel also defines a bar, column, line, area, or scatter charts. This
automatically created chart has an array of design choices available in a
convenient menu.
[Features]
Code Free Data Analysis
To create a pivoting data analyzer, just add the OLAP screen to a LightSwitch
application and connect to a data source. It’s that easy. Run your application
and go.
 Dynamic Views
Dynamically create data views by dragging fields into the row, column and value
lists. This will give you a summary of your data. You can also summarize your
data by modifying the filters. The UI is similar to Microsoft Excel.
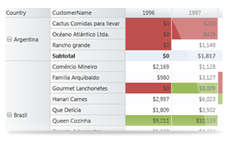
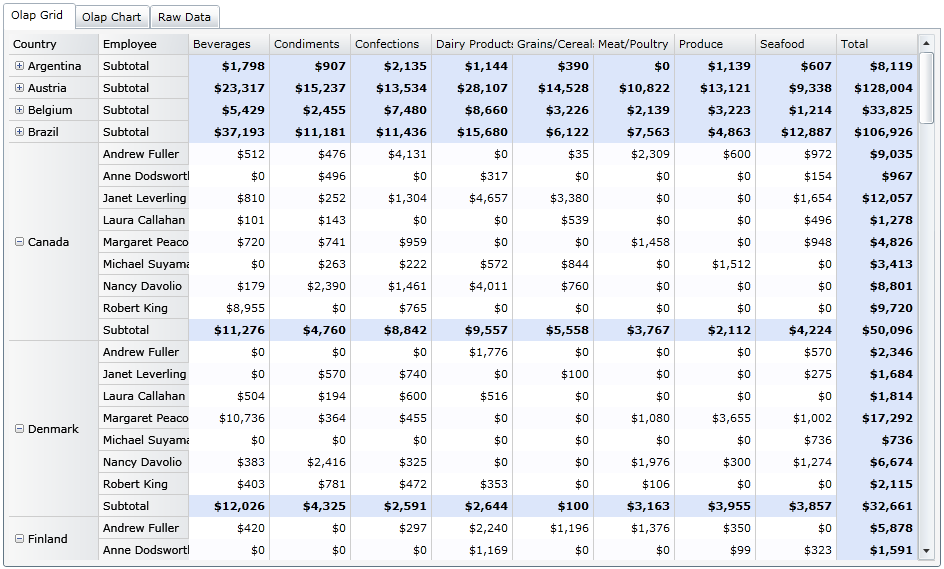 Subtotals and Grand Totals
The OLAP Grid automatically calculates grand totals for each slice of your data.
If you measure multiple dimensions the OLAP Grid can also calculate subtotals
with collapsible headers.
 Multiple Value Fields
You may add as many value fields to a view as you want. This enables users to
aggregate totals for multiple measures from the data set. For example, create a
view that compares both total revenue and cost side-by-side.
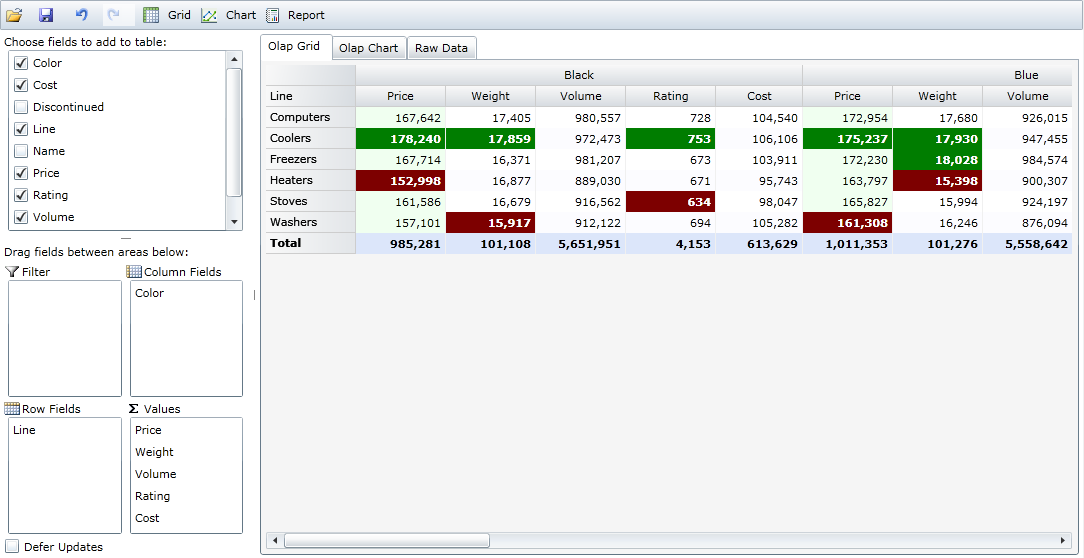
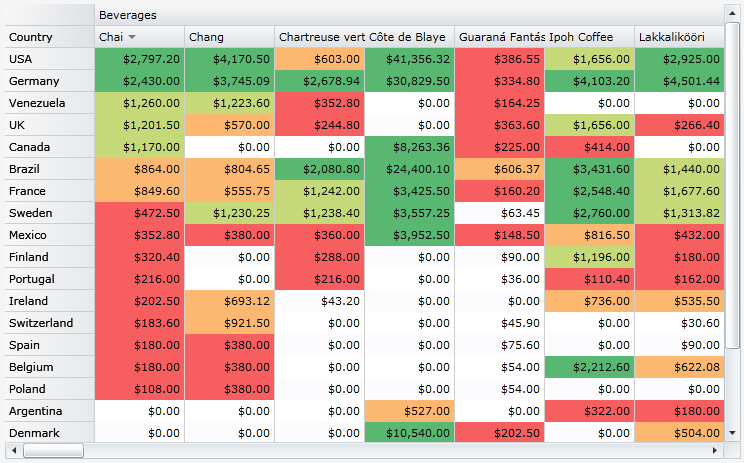 Conditional Formatting
Conditional formatting allows you to draw attention to values that meet certain
criteria. Format thresholds may be specified as absolute values or as
percentages. For example, apply a unique style for values in the top 10% and
another style for values in the bottom 10%.
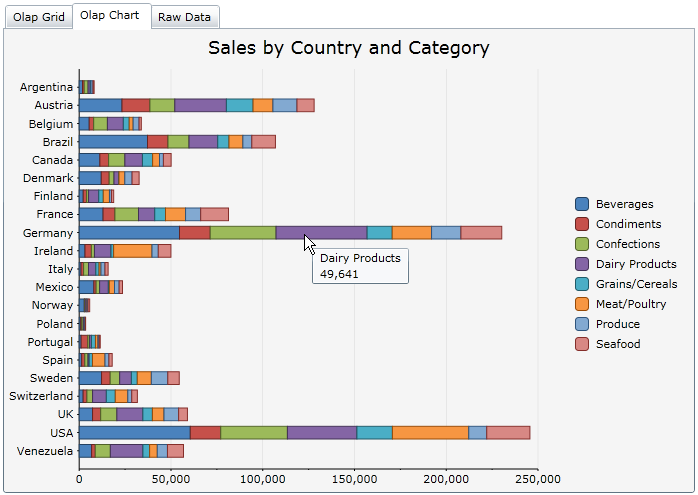 Instant Charts
A chart is automatically created when you set up a view. Five different chart
types (Bar, Column, Area, Line and Scatter), automatic tooltips, stacking and
palette selection are supported.
Export Data
Just click a button and expoert your grid view to CSV, HTML, or TXT.
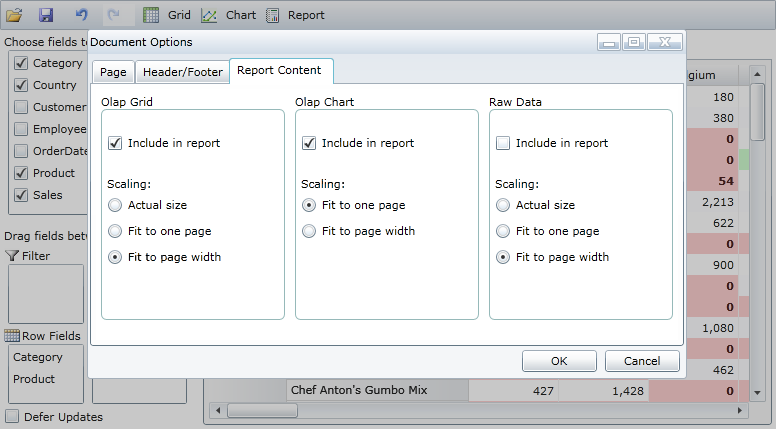 Report Printing
Directly print all the data views in a single report. Users can customize
scaling, page margins, headers and footers, and insert time stamps, page counts
and a title for the report.
Filtering
To narrow down the data pool, use the filter feature. You can filter on multiple
fields. Just right-click on the field you would like to filter and select Field
Settings. From the Field Settings dialog box, you can create your custom text
filter. No coding required.
Totals and Aggregates
Choose from many different aggregations for the totals (Value field). Choose
from Sum, Count, Average, Maximum, Minimum, First, Last, Variance, Standard
Deviation, and Variance Population.
Data Formatting
Format the value field in the Field Settings dialog. Select from decimal,
currency, and percentage formats; or create custom format strings.
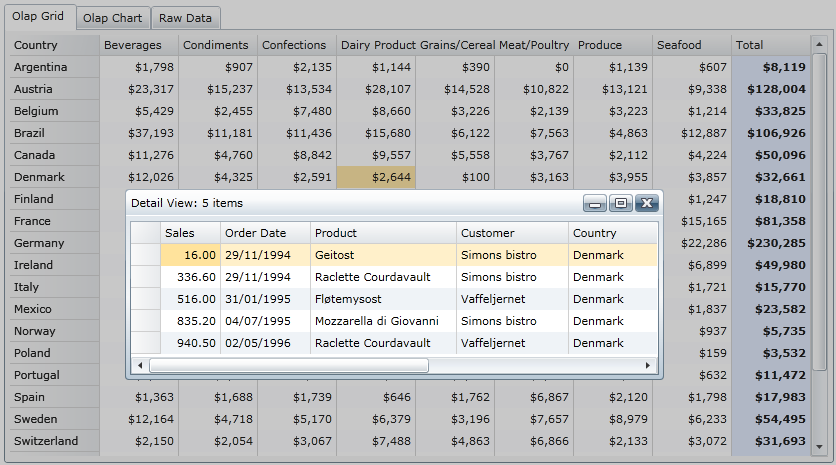 Drill-Down Data
You can see the underlying records behind each aggregated value in the OLAP grid
by double-clicking any cell.
Save/Load Views
Once a user creates a view, she can save it for reloading later.


