C++ memory leak detector - Memory Validator
Memory Validator is a memory
leak and memory error detection
software tool for use by software
developers, software
quality assurance testers and customer support staff.
Use Memory Validator to:
-
Detect memory leaks and handle leaks.
-
Find native memory leaks in mixed-mode .Net applications.
-
Find double deletes, double frees and related memory errors.
-
Find uninitialized memory in C++ objects.
-
Run regression tests to find memory leaks in your overnight
builds.
-
Monitor billions of allocations in your application.
Easy to use
To use Memory Validator all you need is debugging information for
your application and Memory Validator can get to work.You
do not need to modify your software, recompile or relink your software to use
Memory Validator.
-
Launch your application with Memory Validator.
Memory Validator will launch and attach to your application in seconds.
-
Run your application as normal.
-
Close your application.
-
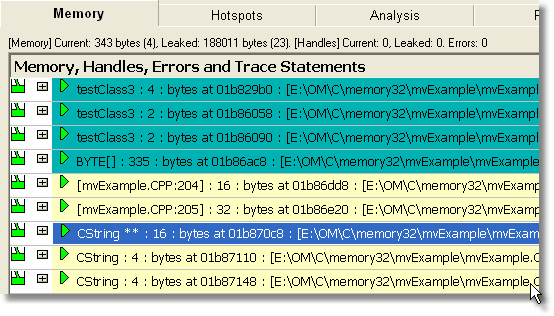
Examine the memory leaks that Memory Validator finds in your
software.
Easy to read data displays show you all the errors in the order
they occurred. The displays can be filtered to
show you only the information that you want to work with.

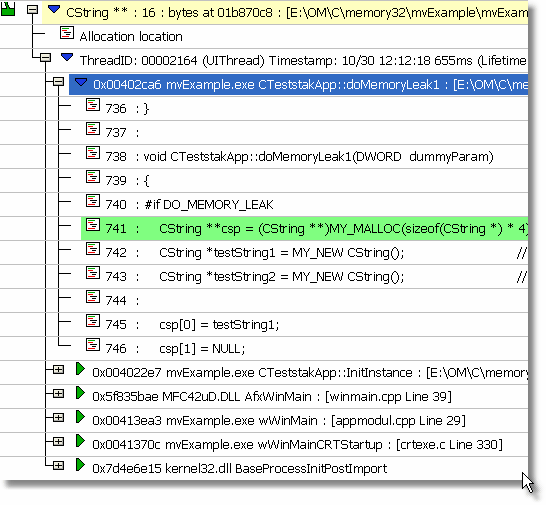
Drill down to the data in the displays by expanding an entry in
the display to display information about the memory leak: Whattype
of object was allocated, what size,
where (address, filename, line number<), thread id, allocation timestamp,
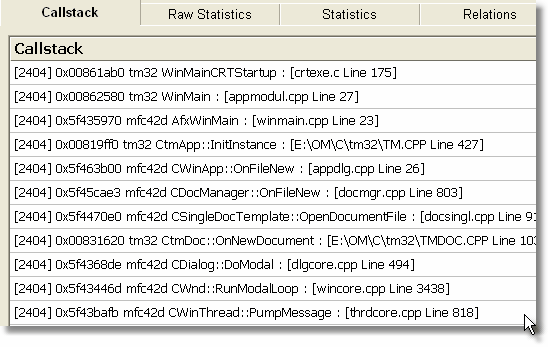
lifetime and sequence id. Also displayed is a comprehensive callstack
showing each class and method name, filename and line number. Each entry can be
expanded to display the source code for that line.

Configurable
Memory Validator can be configured to collect all data or just
the data you need. Powerful filters for collecting data and for displaying
collected data give you maximum flexibility and control over how much CPU time
is spent and how much memory is used collecting data allowing you to choose how
much effort is put into a given task.
Memory Validator provides two
APIs for controlling Memory
Validator from your application. One API is for direct control of Memory
Validator, the other API is for using Memory Validator with services for the
case when Memory Validator cannot inject into a service because of Windows NT
security privileges preventing the injection (typically for services running at
Administrator or system level).
Powerful
The default options of Memory Validator concentrate on C and C++
memory leaks. It is easy to add many other memory types (GlobalAlloc, LocalAlloc,
Heap32, etc...) and handle tracking to the list of data items monitored.
Additional capabilities include uninitialised
data tracking, detection of use of deleted C++ objects, memory corruption
detection, broken message map usage.
Memory Validator provides powerful HTML
and XML reporting capabilities,
allowing you to produce overnight leak reports if you use Memory Validator as
part of regression testing strategy.
Unlike some of our competitors that struggle to handle even one
million allocations, some of our customers are processing billions of
allocations with Memory Validator.
Compatible
Memory Validator works with compilers from:
|
Microsoft |
C++, C, Visual Basic |
|
Intel |
C++, C, Fortran 95 |
|
Borland |
C++, C, Delphi |
|
MinGW |
C++, C |
|
QtCreator |
C++, C |
|
Metrowerks |
C++, C |
|
Salford Software |
Fortran 95 |
All 32 bit Windows operating systems from Windows
7 to Windows NT 4.0 are
supported.
Memory Validator will also run on Windows
64 bit operating systems in
the Wow64 compatibility layer.
For more details, please consult the compatibility
feature list
Multi-purpose
Memory Validator works with applications and services, both native
and mixed-mode .Net.
As well as the traditional interactive memory leak debugging role
that Memory Validator performs, Memory Validator can be used to compare two
recorded sessions to show the difference between the sessions. This allows you
to determine if changes to your code have resulted in improvements (less memory
leaks, less errors) or regressions (more memory leaks, more errors).
Memory Validator also allows you to automate this process by
launching Memory Validator from the command line. A full range of command line
options allow you to perform unattended runs of Memory Validator, complete with HTML
export and XML export, to facilitate regression
testing as part of your
overnight builds.
C++ profiler - C++ Performance Validator
C++ Performance Validator is a C++
performance profiler for use
by software
developers and software quality assurance testers.
Use C++ Performance Validator to:
-
Identify slow (time consuming) functions in your application.
-
Identify busy (called very often, not necessarily slow)
functions in your application.
-
View application behaviour in real time.
-
Improve your software quality testing with interactive,
profiling displays.
-
Create profiling reports with collapsible call tree and call
graphs to share with your team on your intranet.
Easy to use
To use C++ Performance Validator all you need is debugging
information for your application and C++ Performance Validator can get to work. You
do not need to modify your software, recompile or relink your software to use
C++ Performance Validator.
-
Launch your application with C++ Performance Validator.
C++ Performance Validator will launch and attach to your application.
-
Run your application as normal.
-
Close your application.
-
Examine the profiling statistics that C++ Performance
Validator generates as your application runs.
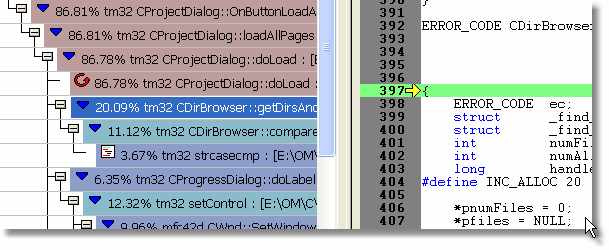
Easy to read data displays show you the performance statistics as
your application executes. You do not need to wait until your application has
finished to view statistics for any function, file or DLL. The displays can be filtered to
show you only the information that you want to work with.

Detailed, colour coded source code shows at-a-glance which
functions and lines have executed and how long each took.

Configurable
C++ Performance Validator can be configured to collect all data
or just the data you need. Powerful filters for collecting data and for
displaying collected data give you maximum flexibility and control over how much
CPU time is spent and how much memory is used collecting data allowing you to
choose how much effort is put into a given task.
C++ Performance Validator provides an API for
using C++ Performance Validator with services for the case when C++ Performance
Validator cannot inject into a service because of Windows NT security privileges
preventing the injection (typically for services running at Administrator or
system level).
Powerful
The default options of C++ Performance Validator provide
profiling data for all DLLs and files in your application that have debugging
information. If you wish to only create profiling reports for selected DLLs, or
exclude certain file types or even specific classes and methods, C++ Performance
Validator has filtering capabilities
to allow such customisation.
C++ Performance Validator provides powerful HTML
and XML reporting capabilities,
allowing you to produce profiling reports that you can share with your
colleagues or post on your company intranet. The HTML reports can include
animated collapsible call trees and call graphs.
Compatible
C++ Performance Validator works with compilers from:
|
Microsoft |
C++, C, Visual Basic |
|
Intel |
C++, C, Fortran 95 |
|
Borland |
C++, C, Delphi |
|
MinGW |
C++, C |
|
QtCreator |
C++, C |
|
Metrowerks |
C++, C |
|
Salford Software |
Fortran 95 |
All 32 bit Windows operating systems from Windows
7 to Windows NT 4.0 are
supported.
C++ Performance Validator will also run on Windows
64 bit operating systems in
the Wow64 compatibility layer./p>
For more details, please consult the compatibility
feature list
Multi-purpose
C++ Performance Validator works with applications and services,
both native
and mixed-mode .Net.
As well as the traditional performance profiling role that C++
Performance Validator performs, C++ Performance Validator can be used for
interactive profiling and for creating profiling reports automatically as part
of a regression test suite and/or overnight build.
C++ Performance Validator also allows you to automate this
process by launching C++ Performance Validator from the command line. A full
range of command line options allow you to perform unattended runs of C++
Performance Validator, complete with HTML
export and XML export, to facilitate regression
testing as part of your
overnight builds.