AnyChart is a
flexible Flash/JavaScript
(HTML5) based charting solution.
AnyChart enables any organization to add cross-browser and cross-platforminteractive
charts, dashboards, graphs and maps to their applications.
Using AnyChart, our customers are able to maximize the value of their
applications by easily adding data visualization tools that:
- Enable better analysis and decision making by allowing comprehensive and
free-flowing data exploration. This provides the ability to spot patterns
and trends.
- Increase customer satisfaction by enhancing the look of any application,
report, or presentation.
- Lower developments cost and speed time-to market.
We currently provide charting solutions to thousands of companies in over 100
countries across all industries. Leaders
trust us.
With our extensive Partner
Program our solution enhances the
visualization for their clients with an out of the box solution to their
specific needs.
AnyChart Features
 |
Save chart as Image |
|
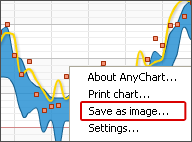
AnyChart allows to save chart as image by clicking right mouse button
and selecting "Save as Image". Also this feature allows to automate
server side report generation. AnyChart is the
first product that
supports this feature! To test this feature please visit our gallery,
open any sample and click right mouse button on any chart. |
 |
Correct printing with FireFox browser |
|
Everybody knows that when you’re trying to get “Print preview” in
Firefox some “strange” things happen: all Flash content disappears.
AnyChart is the first
product that solves
this issue. |
 |
Multiple Axes |
|
Multiple Axes feature allows to display several scales when dealing with
data. Each axis can be customized using its properties to meet your
needs. You can have as many axes as you want. Any data series can be
linked to any axis, you can compare different series using different
scales or display different scales for the same data. Any axis can be
positioned and completely customized. |
 |
True Date/Time support |
|
AnyChart supports date/time - it means you can operate with any
date/time data without converting it. Both ordinal (categorized: bar,
column, etc.) and value scales are supported. You get full control over
any settings (interval, min/max control, etc). Completely customizable
data input (any format of date/time data, including UNIX time stamps).
This feature allows to to have use advanced formatting for axis, data
labels and tooltips. |
 |
Logarithmic Scales |
|
AnyChart can plot chart using logarithmic scales for any chart type.
Both X and Y scales can be logarithmic. The base of log scale can be
customized. Please note that such scales are fully configurable as usual
scales. Logarithmic scales is must-have feature for all scientific and
financial charts. |
 |
Axis positioning |
|
There are full control available for axis position for any chart type
and any combinations. There are 32 different combinations of axis
positions available. |
 |
Axis inversion |
|
You can invert an axis for any chart type and any combinations. Also
with axis you'll get your data inverted. It works for all types of
scales: usual, logarithmic, date/time. Both X and Y axis support this
feature. |
 |
Interactive Gauges and Gauge Dashboards |
|
Feature rich Gauge Engine allows creation of Editable Interactive
Gauges, Composite Gauges and Gauges with real-time update. |