Community Analysis Package 4:
- A
unique range of analyses available, covering both metric and non-metric
methods, in one easy-to-use package
- New methods:
Discriminant Analysis, Species Matching and Mahalanobis distance have been
added, with many other improvements in the existing methods.
- A fantastic new feature
lets you assign points to a group simply by dragging over them on the chart.
You can create a group from one analysis and see if it persists in another.
The original method of assigning groups has been improved to show the
groups' names and colours
- Improved graphics!
Plotting of graphs and dendrograms improved; plot groups of samples in
different colours and styles, switch on drop-down stalks, use graph themes
and change the line and font size – all using the new graph toolbar. Get
your results ready for publication, quickly and easily!
- Open Excel files,
without needing to have Excel installed on your computer.
- The Demo now includes a
wide range of data sets, and all the video Guides and Help system can be
seen on the website, so you can understand and explore everything that CAP4
can do for you.
- Unlike non-commercial
packages, we offer full support - which means you can complete your analysis
when it really matters, and you get the help you need, when you want it!
Community Analysis Package 4 gives you superb graphics, ease of use, and top
quality support, with all the methods you need - in one software package!
.jpg)
The Working Data grid in CAP presents the data in a straightforward grid. For
biological data, the rows can represent species, and the columns hold sites or
samples. For other disciplines, the rows can represent (for instance) physical
parameters or measurements, and columns hold objects, single study individuals
or groups.
On the Working Data grid, the user can apply a wide range of transformations to
the data, without the original data file being affected. The data set in this
example is numbers of freshwater invertebrates in samples from chalk streams in
Southern England.
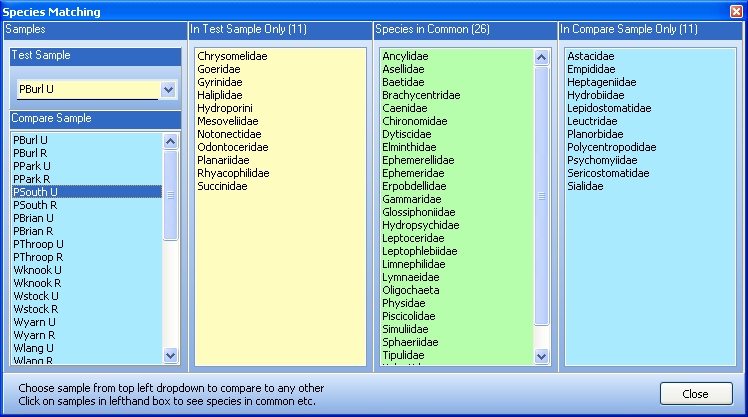
Species Matching allows you to choose a pair of samples, and instantly view
which species (or other variables) they have in common, and which occur in one
or other sample.


