새 페이지 1
|
Harvard ChartXL 3.0 Creates Any Chart For Any Type of
Data
Harvard ChartXL combines professional-level graphic and
layout capabilities with advanced data organization and analysis tools
to facilitate outstanding chart results, even for complex or large
amounts of data. In addition to a made-over interface, Harvard ChartXL
3.0 combines the product's most important legacy features with new
capabilities that bring it up to speed with current technologies and
facilitate greater ease of use. A user may:
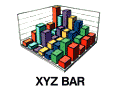
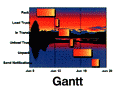
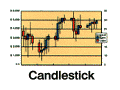
Select from Over 300 Business, Statistical and Technical
Charts
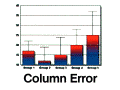
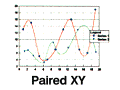
Includes basic business layouts like Column, Line, and
Gant, and sophisticated Box-Whiskers, Trajectories and Spectral Plots,
neatly categorized as either business, statistical and technical. 2D and
3D effects can be applied to a chart with a single mouse click, while
Harvard ChartXL's AutoFit technology allows a user to change styles
instantly without modifying the underlying data.
Find the Best Chart for Your Data
Harvard ChartXL's "Advisor" explains the intended use for
each of the 300 available charts. For example, click on "star chart" and
the Advisor explains its general "usage" is for proportional
comparisons. The Advisor then explains in detail how the chart's
characteristics represent grouped values. A user may even edit the
descriptions provided in the Advisor for customized instruction.
Manipulate Data in the Built-in Spreadsheet
In addition to supporting data input from outside
spreadsheets, data may be entered directly into Harvard ChartXL's
built-in spreadsheet application, designed to resemble popular
spreadsheet programs for little or no learning curve. It comes complete
with multiple workbooks, number, font and graphic formatting features.
View Data and Charts Simultaneously
Rather than flip-flopping between the program's
spreadsheet and chart views, Harvard ChartXL provides a convenient split
view option for simultaneous viewing.
Compute Trends, Averages and Interpolations with One
Mouse Click
Harvard ChartXL's one-touch Business Statistics toolbar
provides several icons for one-click computation of interpolations, as
well as linear, exponential, polynomial, and cyclical trends, and moving
averages, minimums, maximums, standard deviations and variances. The
computation is displayed as a line on the chart, while the computed data
is automatically placed in a separate spreadsheet.
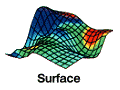
Analyze Data with Powerful Analysis Tools
Select from one of the 69 predefined functions, define
the cell range, and Harvard ChartXL quickly analyzes the formula. In
addition to mainstream functions like "count" and "absolute value",
Harvard ChartXL also provides "kronecker delta", "hyperbolic sine", and
other functions suitable for the most eclectic analysis. Harvard ChartXL
even provides a "Formula Visualizer" to aid in the creation and
evaluation of equations for creating sophisticated curve and surface
charts.
Create Layers of Data
With the simple "Add Data" command, data from different
spreadsheets may be added to a single chart, with automatic links to
update the chart if changes to the spreadsheet data occur. For example,
one chart can simultaneously depict two different sets of data, the
results layered as a bar and line chart.
Correct Data Entry Confusion with the Range Highlighter
The "Range Highlighter" selects the cell range in a
spreadsheet where particular data should be entered. For example, a user
wants to create a bubble chart, but is unsure which cells designate the
"area value" in the spreadsheet. By selecting "area value" on the Range
Highlighter, the relevant cell range will be both highlighted and
defined for instant location. |
|

|
Visually Locate Your Data
With Harvard ChartXL's "Data Cursor", a user may select a data
point on a chart and, depending on the chart type, view the value of the data
point, type a new value, or drag the data point to a new location.
For example, a user has created a line chart, but a peak in the curve looks
peculiarly elevated. Rather than scan the spreadsheet to find and double check
the corresponding data, the user may simply mouse click the peak with the Data
Cursor and the data value will appear in the "Data View". The spreadsheet cell
for the data will automatically highlight for convenient tracking.
(NEW) Apply Professional-looking Color Schemes in Seconds
Harvard ChartXL now offers a complete palette of preset color
schemes in a preview menu for rapid, interchangeable application to charts,
graphic and text objects, as well as page backgrounds. For hurried business
pros, the new color schemes are an invaluable time saver, ensuring
professional-looking presentation results in seconds.
Create Any Chart Design with Advanced Graphic Support
Harvard ChartXL's comprehensive graphic support provides optimal
control over chart design, and superior chart results. For example, the number
and style of axes, the color, format and option to hide chart elements like tick
marks, and the font style and look are among the chart characteristics entirely
under user control. A user may also customize solid, gradient, and patterned
fills, or even import bitmaps as a chart background. A chart may be exactly
positioned on a work page using the layout grid and move controls, while a
preview screen shows a chart in color or black and white to illustrate how it
will look outputted via a particular type of printer. After creating the ideal
chart, simply save the template for future projects.
Apply Different Perspectives with the Rotation, Scale and
Perspective Tools
Harvard ChartXL offers easy to use tools for changing the
vertical, horizontal and spin rotation--full screen--of a chart, as well as its
scale and depth perspective. The result is superior graphical impact than
provided by standard spreadsheet and presentation programs.
(NEW) Import and Export Both Data and Charts
Harvard ChartXL's import capabilities have been enhanced to
support most spreadsheet programs, including Microsoft Excel 95 and 98, and most
versions of Lotus, in addition to Data, Text and DIF files. Links may even be
established by the user between a ChartXL chart and its supporting, outside
spreadsheet program for automatic updates to chart data. Additionally, Harvard
ChartXL supports several new graphic file formats for chart export, including
GIF, JPEG, Metafile, and PNG.
Drag and Drop into Outside Programs
Charts may be quickly dragged and dropped into any standard
presentation, desktop publishing, word processing or spreadsheet program.
System Requirements
Minimum Requirements:
- Windows 95, Windows 98, 98SE, ME, Windows NT 4.0, Windows
2000, compatible with Windows XP in single user mode
- 486 Processor - Pentium processor or above recommended
- 8 MB RAM - 16 MB RAM Recommended
- 18 MB available hard disk space
- VGA 256 color display - Recommended Hi-Color.
- Mouse or other pointing device
- CD ROM drive


