[Overview]
Source Code Analysis & Metrics
Understand is a static analysis tool for maintaining,
measuring, & analyzing critical or large code bases.
From metrics and graphs to dependency analysis, Master your
source code with Understand
[Features]
| Metrics
Measure your software |
Standards Testing
Verify your coding standards are being met with Code
Check |
Editor
Powerful programming features |
| Dependencies
See the big picture |
Languages
C, C++, C#, Objective C, Ada, Java, Pascal,
Cobol, JOVIAL, VHDL, FORTRAN, PL/M,
Python, PHP, HTML, CSS, JavaScript, XML |
Searching
Instant & accurate |
| Graphs
Over 20 different graphs |
Code Knowledge
Be the guru |
Reports
Canned and Custom |
<Metrics>
Standard Metrics
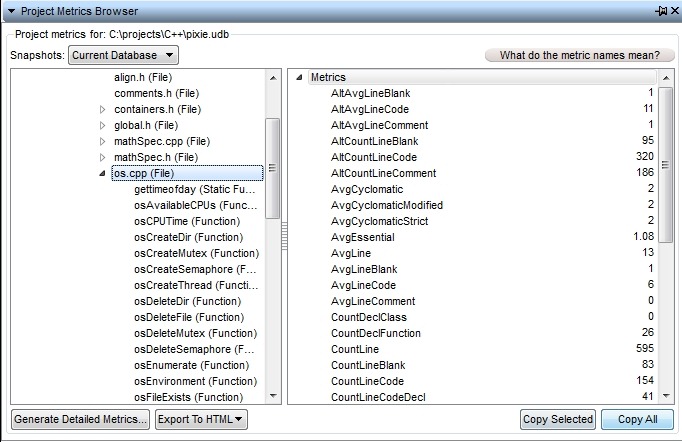
Understand is very efficient at collecting metrics about the
code it analyzes. These metrics can be extracted automatically via command line
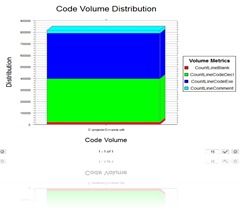
calls, exported to spreadsheets, viewed graphically, dynamically explored in the
GUI, or customized via the Understand Perl API. They can also be reported at the
project level, for files, classes, functions or user defined architectures.
Most of the metrics in Understand can be categorized in the following groups:
• Complexity Metrics (e.g. McCabe Cyclomatic)
• Volume Metrics (e.g Lines of Code)
• Object Oriented (e.g. Coupling Between Object Classes)
WWe don't push a particular coding methodology and we consider
ourselves "Metric Agnostic". We won't tell you that your code is "good" or "bad"
we just try to report the data in the most flexible manner possible and let your
team interpret it however you think best. Click here for a list of all available
metrics.
Custom MetricsThe
metrics included with Understand have evolved over many years to
accommodate common customer requests. However, we recognize that
not all needs can be covered. To help you develop custom metrics
there is a full Perl API interface to the Understand database as
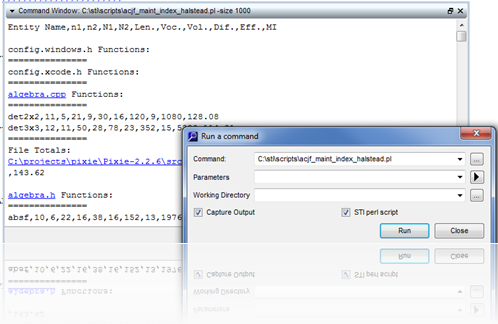
well as a fully developed plugin mechanism. For example, the
script below generates the Halstead Maintainability Index for
every file and function in your project. For details on the PERL
API and using and developing plugins, visit the Plugins section.
<Standards Testing>
Code Check
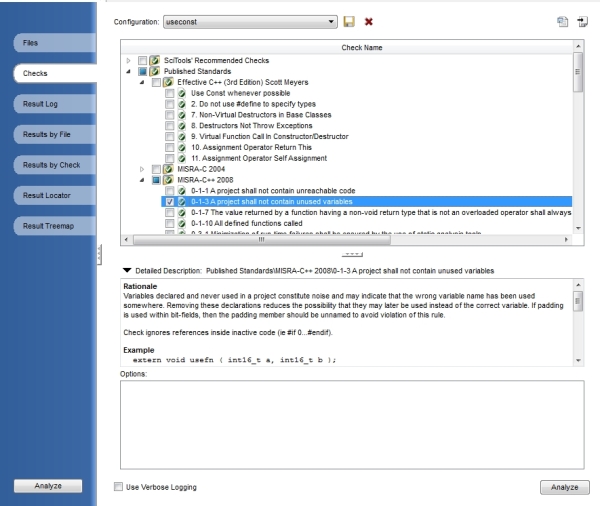
Understand now provides a way to check your code using
published coding standards, or your own custom standards. These checks can be
used to verify naming guidelines, metric requirements, published best practices,
or any other rules or conventions that are important for your team.
Published Coding Standards
You will find many "checks" straight from the following
published standards:
• Effective C++ (3rd Edition) Scott Meyers
• MISRA-C 2004
• MISRA-C++ 2008
Custom Checks
Does your team have specific standards that you would like to
easily test for but the check isn't already in the collection of checks included
in Code Check? Send us an email to support@scitools.com with your team's
standards and we will send you a quote. To write your own standards, follow
these instructions.
<Editor>
Streamlined Interface
Our goal for the Understand editor was to provide something
equal to the top programming editors, but also give it lots of features for
maintaining and understanding code. And that's what we've achieved -- the best
programming editor for maintaining code.
The Understand GUI incorporates modern features like tabs, tab groups and
docking, to name just a few. The editor has all the features you would expect,
such as syntax colorization, auto-completion and syntax-based collapsing &
folding.
In the C portion of the editor, when working in C-preprocessing regions, the
option is there to hide or show active & inactive regions. This is a huge
benefit for users working extensively with the C-preprocessor.
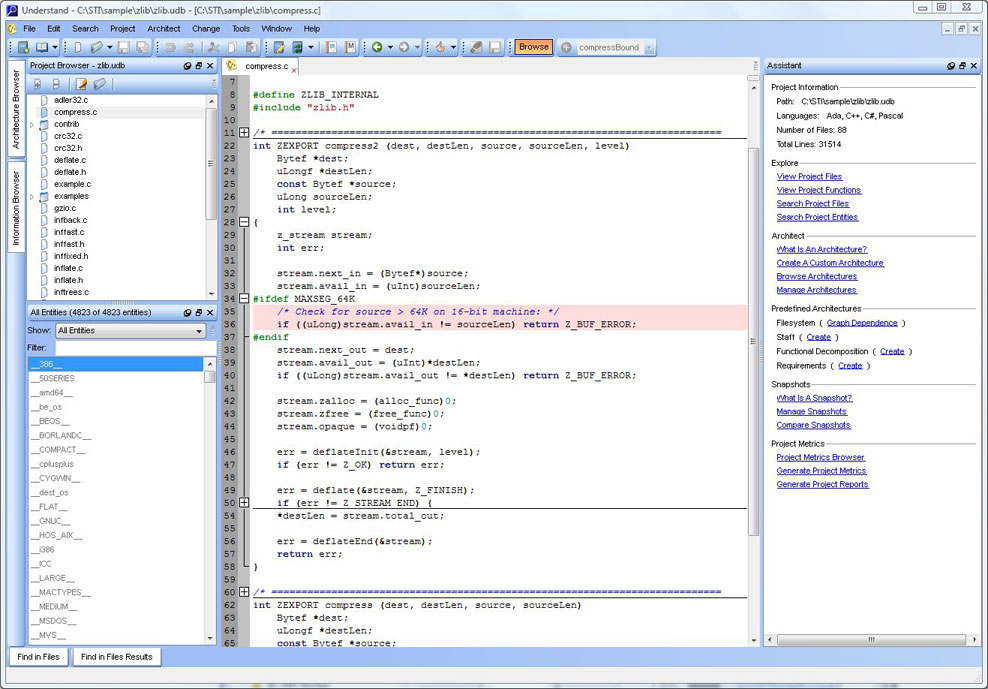
Browse Mode
The "browse mode" in Understand turns the editor into a web
browser for code. Essentially, Understand shifts from the editing mode to
browsing, and as you move around in the code it pushes information about the
code to you as you work. This makes understanding your code very easy, just
click on what you want to know about and all the information is readily
available.
Compare
File and Folder Comparing
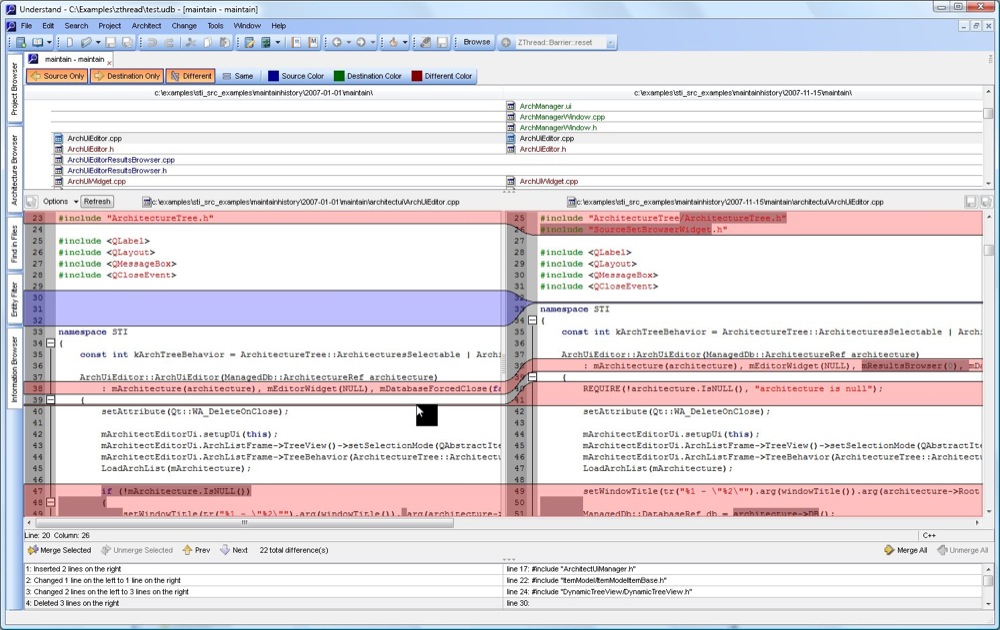
This feature lets you compare entities, files and folders.
This becomes very useful when you have sections of code or functions that are
similar. By comparing entities, you can quickly see why one is working and the
other isn't, or if you can combine them. Comparing files works great for merging
in changes that others have made to the code. And comparing folders tells what
files are new, which ones aren't in the newest version, and files that are
different between versions. None of this requires a parse, which makes it very
fast.
Improved Diff
Understand's "diffing" function is quite powerful, and since
it is integrated into the application, all the code navigation features
available with it. This makes it much easier for you to find things and focus on
what you need to do. Its visual overlay system identifies changes at a glance.
It also performs "character diffing", highlights individual characters that are
different from one place to the next, and immensely useful advantage. Everything
is integrated at the menu level, which makes finding functions or classes, and
diffing them from others, quick and easy.
Custom Editor
Understand lets you create your own customized workspace to organize
information, palettes, source code, etc. No need to choose between separate
windows (SDI model) or an all-in-one window (MDI model), this GUI operates in a
whole new way. You can put windows anywhere you want. You can place windows
inside other windows. You can drag them out and put them on another monitor.
Whatever works best for the job you're doing.
<Dependencies>
Dependency Browser
We’ve had dependency analysis in Understand for
many years and have consolidated it into a functional area of the
tool, improved what it does, and also added a few dependency views.
The Dependency Analysis capability provides these
features:
- Rapid browsing of dependencies for files and
Understand architectures
- List "dependent", and "dependent on" entities,
for files and architectures
- Spreadsheet export of dependency relationships
- A Dependency Browsing dock that shows all
dependency information
Lots of Data
To calculate dependency we examine every refererence
in an Understand project. We then build up dependency data
structures for every file and architecture. This includes the nature of
the dependency and the references that caused the dependency. All of
this data is instantly available for quick exploration and browsing.
Exploring
Dependencies
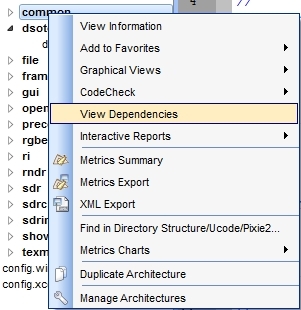
See the dependencies for any file, directory or
architecture by right clicking on the entity and selecting ”View
Dependencies” from the context menu.
The Dependency Browser then pops up, by default docked
to the bottom of the interface.
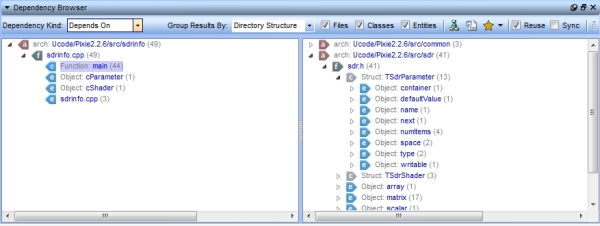
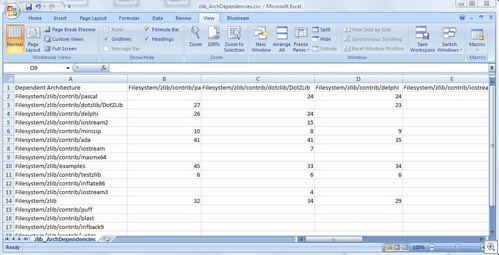
The browser has many options available to customize
the window to your needs, and once you have it like you want, you can
export the dependencies to a csv file.
Dependency Graphs
Understand can generate graphs that show the hierarchy of an
architecture, or just a sub-hierarchy. These graphs can be saved as PNG, JPEG,
SVG, or they can be saved directly to Visio for further editing.
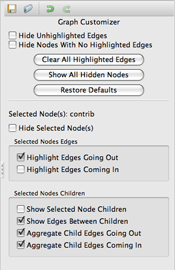
The dependency graphs include a customizer pane. This allows you to modify the
graph display by controlling expansion, highlighting, and arrows on a per-node
basis. Node children and Edges coming in and going out are easy to see and
identify using the customization provided.
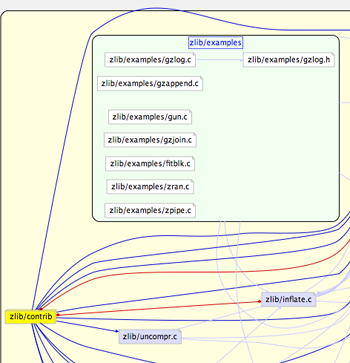
For example, the following graph shows the files that are
"depended on by" zlib\contrib using red edges, and the files that zlib/contrib
"depends on" with blue edges. The dependencies for the other files are still
visible, but are faded out to allow easier viewing for the node you are
interested in.
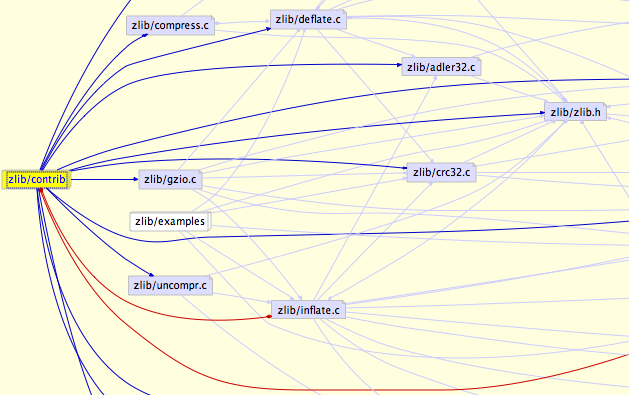
Each node that is drawn as a 3D box in the above image, can also be expanded to
show its child nodes, such as zlib/contrib and zlib/examples.
Detailed graph functionality can be seen in the Dependency Graphs video.
Export Dependencies
Data Export
You can export relationship information for a file or
architecture to CSV format by clicking on the icon. This will output dependency
relationships in matrix form for that entity.
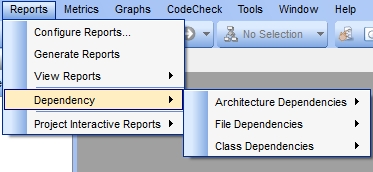
You can also get the matrix for all files or architectures by
choosing the CSV export options from the main Reports->Dependency menu:
<Languages>
Supported Languages
The following list provides a brief overview of the language
versions and/or compilers supported:
• Ada: Understand supports Ada83, Ada95, and Ada05 code,
separately, or in combination.
• C/C++: Understand analyzes K&R or ANSI C source
code and most constructs of the C++ language. Understand works with any C
compiler, and has been tested with most of the popular ones. Note that C++
templates are not yet supported.
• C#: Understand supports C#.
• FORTRAN: Understand supports FORTRAN 77,
FORTRAN 90, FORTRAN 95, and FORTRAN 2003 in both free and fixed format.
Extensions supported include Harris FORTRAN and DEC FORTRAN. We often expand
Understand to support common compiler extensions. If you find that the compiler
extensions you are using are not currently supported, contact us at
support@scitools.com.
• Java: Understand supports most of JDK 1.3, 1.4,
5, and 6. Specifically, the generics introduced in JDK 5 are not currently
supported. Source code containing generics may be analyzed but generics
information will be ignored.
• JOVIAL: JOVIAL73 and JOVIAL3 are supported.
• Pascal: Understand supports all versions of
Borland's Delphi language and Borland's Turbo Pascal language. It also supports
ISO 7185: 1990 (also known as Unextended Pascal) with DEC Pascal extensions. You
can also enable support for Ingres embedded SQL statements.
• PL/M: The standard version for PL/M 80/86 is
supported.
• VHDL: We support VHDL-87, VHDL-93, and
VHDL-2001.
• Cobol: Understand supports COBOL 85.
• Web Languages: Understand supports PHP, HTML,
CSS, and JavaScript. XML is also a supported language that Understand provides
several metrics for: counts for total lines, code lines, blank lines, and
comment lines.
• Python: Understand supports Python Version 2
and Python Version 3.
Combined Language Analysis
With Combined Language Analysis, Understand can handle code
bases written in multiple languages, such as C++ and Java, or Ada combined with
FORTRAN.
Most large projects involve more than one programming language. For instance,
new Java code will depend on an existing C++ library. Some of our customers
projects involve three or four languages. For instance, Ada calling C, which
calls Java, and then the Ada calls FORTRAN for Math functions.
Understand's Combined Language Analysis feature follows jumps between languages
so that you can get consolidated information about the complete system.
Combined code only needs to be parsed one time, instead of parsing for each
language present in the source. Moreover, once parsing is done, Understand shows
the dependence between parts of the code written in different languages.
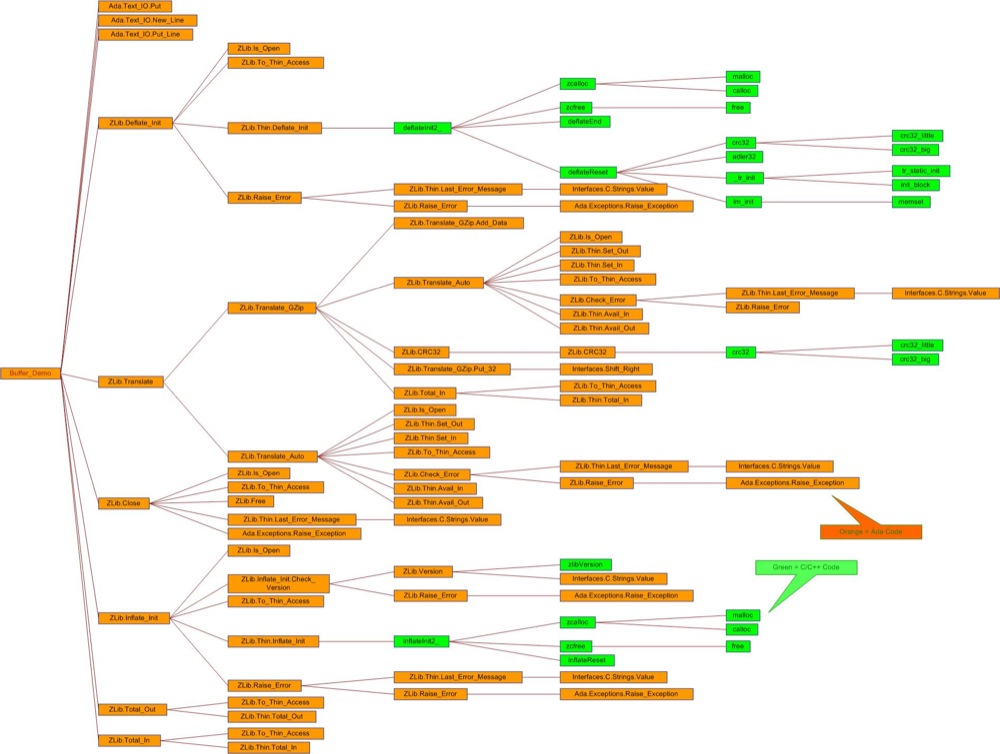
For an example of this, see the ZLib project that we ship as an example project
(Help -> Example Projects). It has C, C++, C#, Assembly, Ada, Delphi, and
Pascal.
<Searching>
Instant Search
What is Instant Search?
Instant Search lets you search millions of lines of source
code instantly. It is so fast that if you type slowly it will be updating
results based on what you are typing.
Instant Search relies on an index of your source code that is built after
parsing. This index is incrementally updated as files change. Indexing happens
in the background and does not interfere with other Understand operations. The
index crosses all projects so that making new projects doesn't require
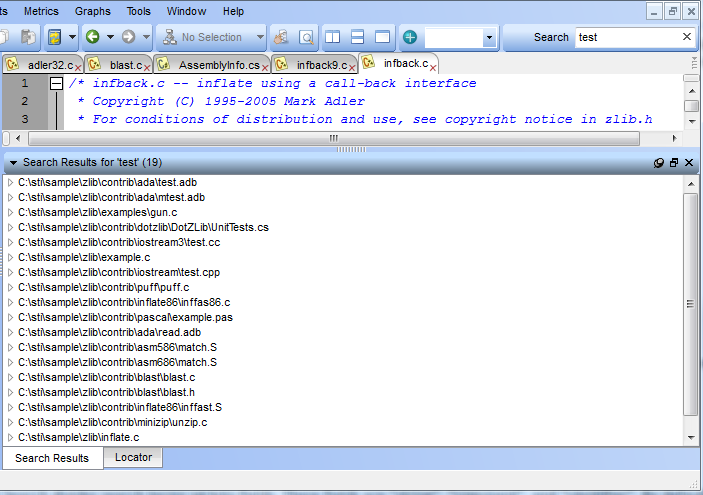
re-indexing the same code. Search results, however, are limited to just the
current project if a project is open.
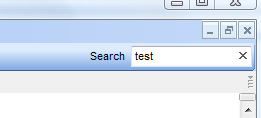
The search box can be found in the upper right of Understand's main window:
What can I search for?
By default Instant Search looks at all your code. For C/C++/Java/Ada it breaks
up the code following syntactic and lexical conventions of the language. For
other languages it breaks it up using white space and punctuation. So, for
instance, in this line:
foreach (i=1,i<10,i++)
you could look for "foreach", i, 1, and 10. These are called "search terms".
Additionally, Instant Search divides search terms up into fields. These fields
are "string", "comment", and "identifier". By default it searches among all
three fields, but you can limit searches to a particular field.
What is the search syntax?
The simplest is to type the term you are searching for,
remembering that ALL searching is case sensitive:
But the syntax is richer than that, permitting some relatively
complicated queries.
Examples:
String: test - searches for "text" only in "strings"
Identifier: test - searches for identifiers named test
Comment: test - searches for comments with "test" in them
test this - matches anything test OR this
Wildcard Examples:
test* - searches for anything beginning with "test"
te?t - searches for anything starting with "te", then any letter, and "t"
test*bug - searches for anything starting with "test" and ending with "bug"
test~ - using a "fuzzy" search. This would match "best" "test" "quest" and other
works "like" test
Boolean Examples:
test AND bug - returns matches for documents containing test AND bug
test OR bug - same as test bug
+test bug - results must contain "test" and may contain "bug"
test this NOT that - results will be documents containing "test this" that also
do NOT have "that"
test this -that - same as NOT above
(test this) and that - paranthesis group search queries. This would match "test
or this" and then "that"
Notes:
The syntax, which is based on the CLucene syntax, is rich.
More details can be found at http://sewm.pku.edu.cn/src/other/clucene/doc/queryparsersyntax.html
One difference in our implementation is that multiple fields cannot be searched
in one expression (e.g. comment: foo string: foo2)
Understand Instant Search terms are always one word - so "foo bar" together in
the document cannot be searched for.
<Graphs>
Declaration Graphs
All of Understand's graphs can be configured in a myriad of
ways. They can also be copied to the clipboard, saved as an image, saved as a
vector image or saved directly to Visio for further editing.
Printing can be to a single sheet or divided among N sheets that are then pieced
together (poster printing). All graphs can be generated automatically via
scripts permitting easy update of "As Built" documentation.
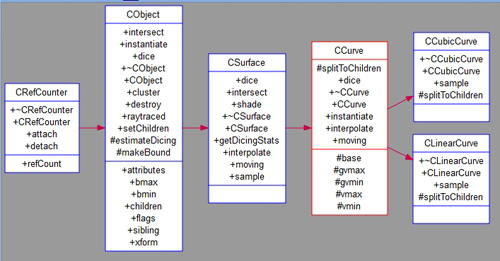
Example Declaration Graph of an Ada Package:
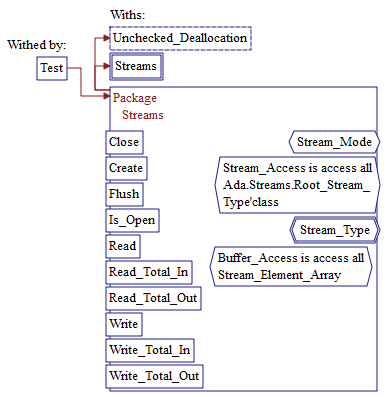
Note that items like "Close" that extend out of the main box
are globals.
Items like "Buffer Access" which are inside are private.
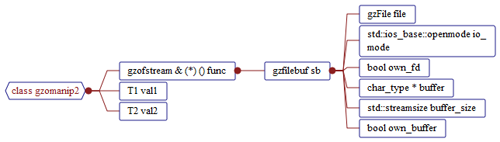
Example Declaration Graph of a C++ Method:
Hierarchy Graphs
All of Understand's graphs can be configured in a myriad of
ways. They can also be copied to the clipboard, saved as an image, saved as a
vector image or saved directly to Visio for further editing.
Printing can be to a single sheet or divided among N sheets that are then pieced
together (poster printing). All graphs can be generated automatically via
scripts permitting easy update of "As Built" documentation.
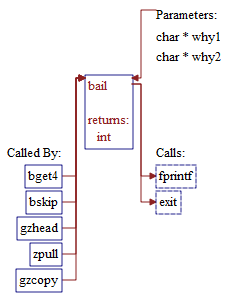
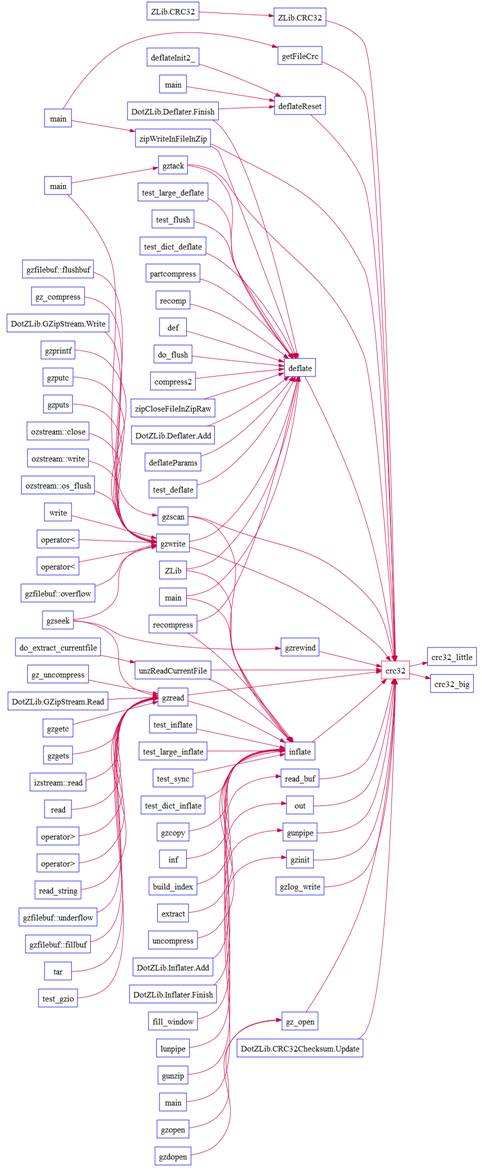
Example Hierarchical Graph (Calls) of C function Main:
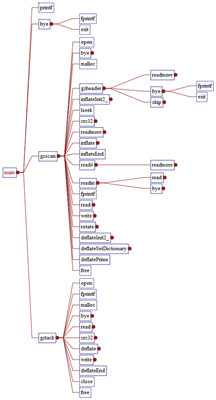
This tree has been manually expanded and contracted to just show what is
desired.
Example Hierarchical Graph (Expanded Data Members) of a C++ Class:
This graph shows all the data fields in the main and children
class or sub-types.
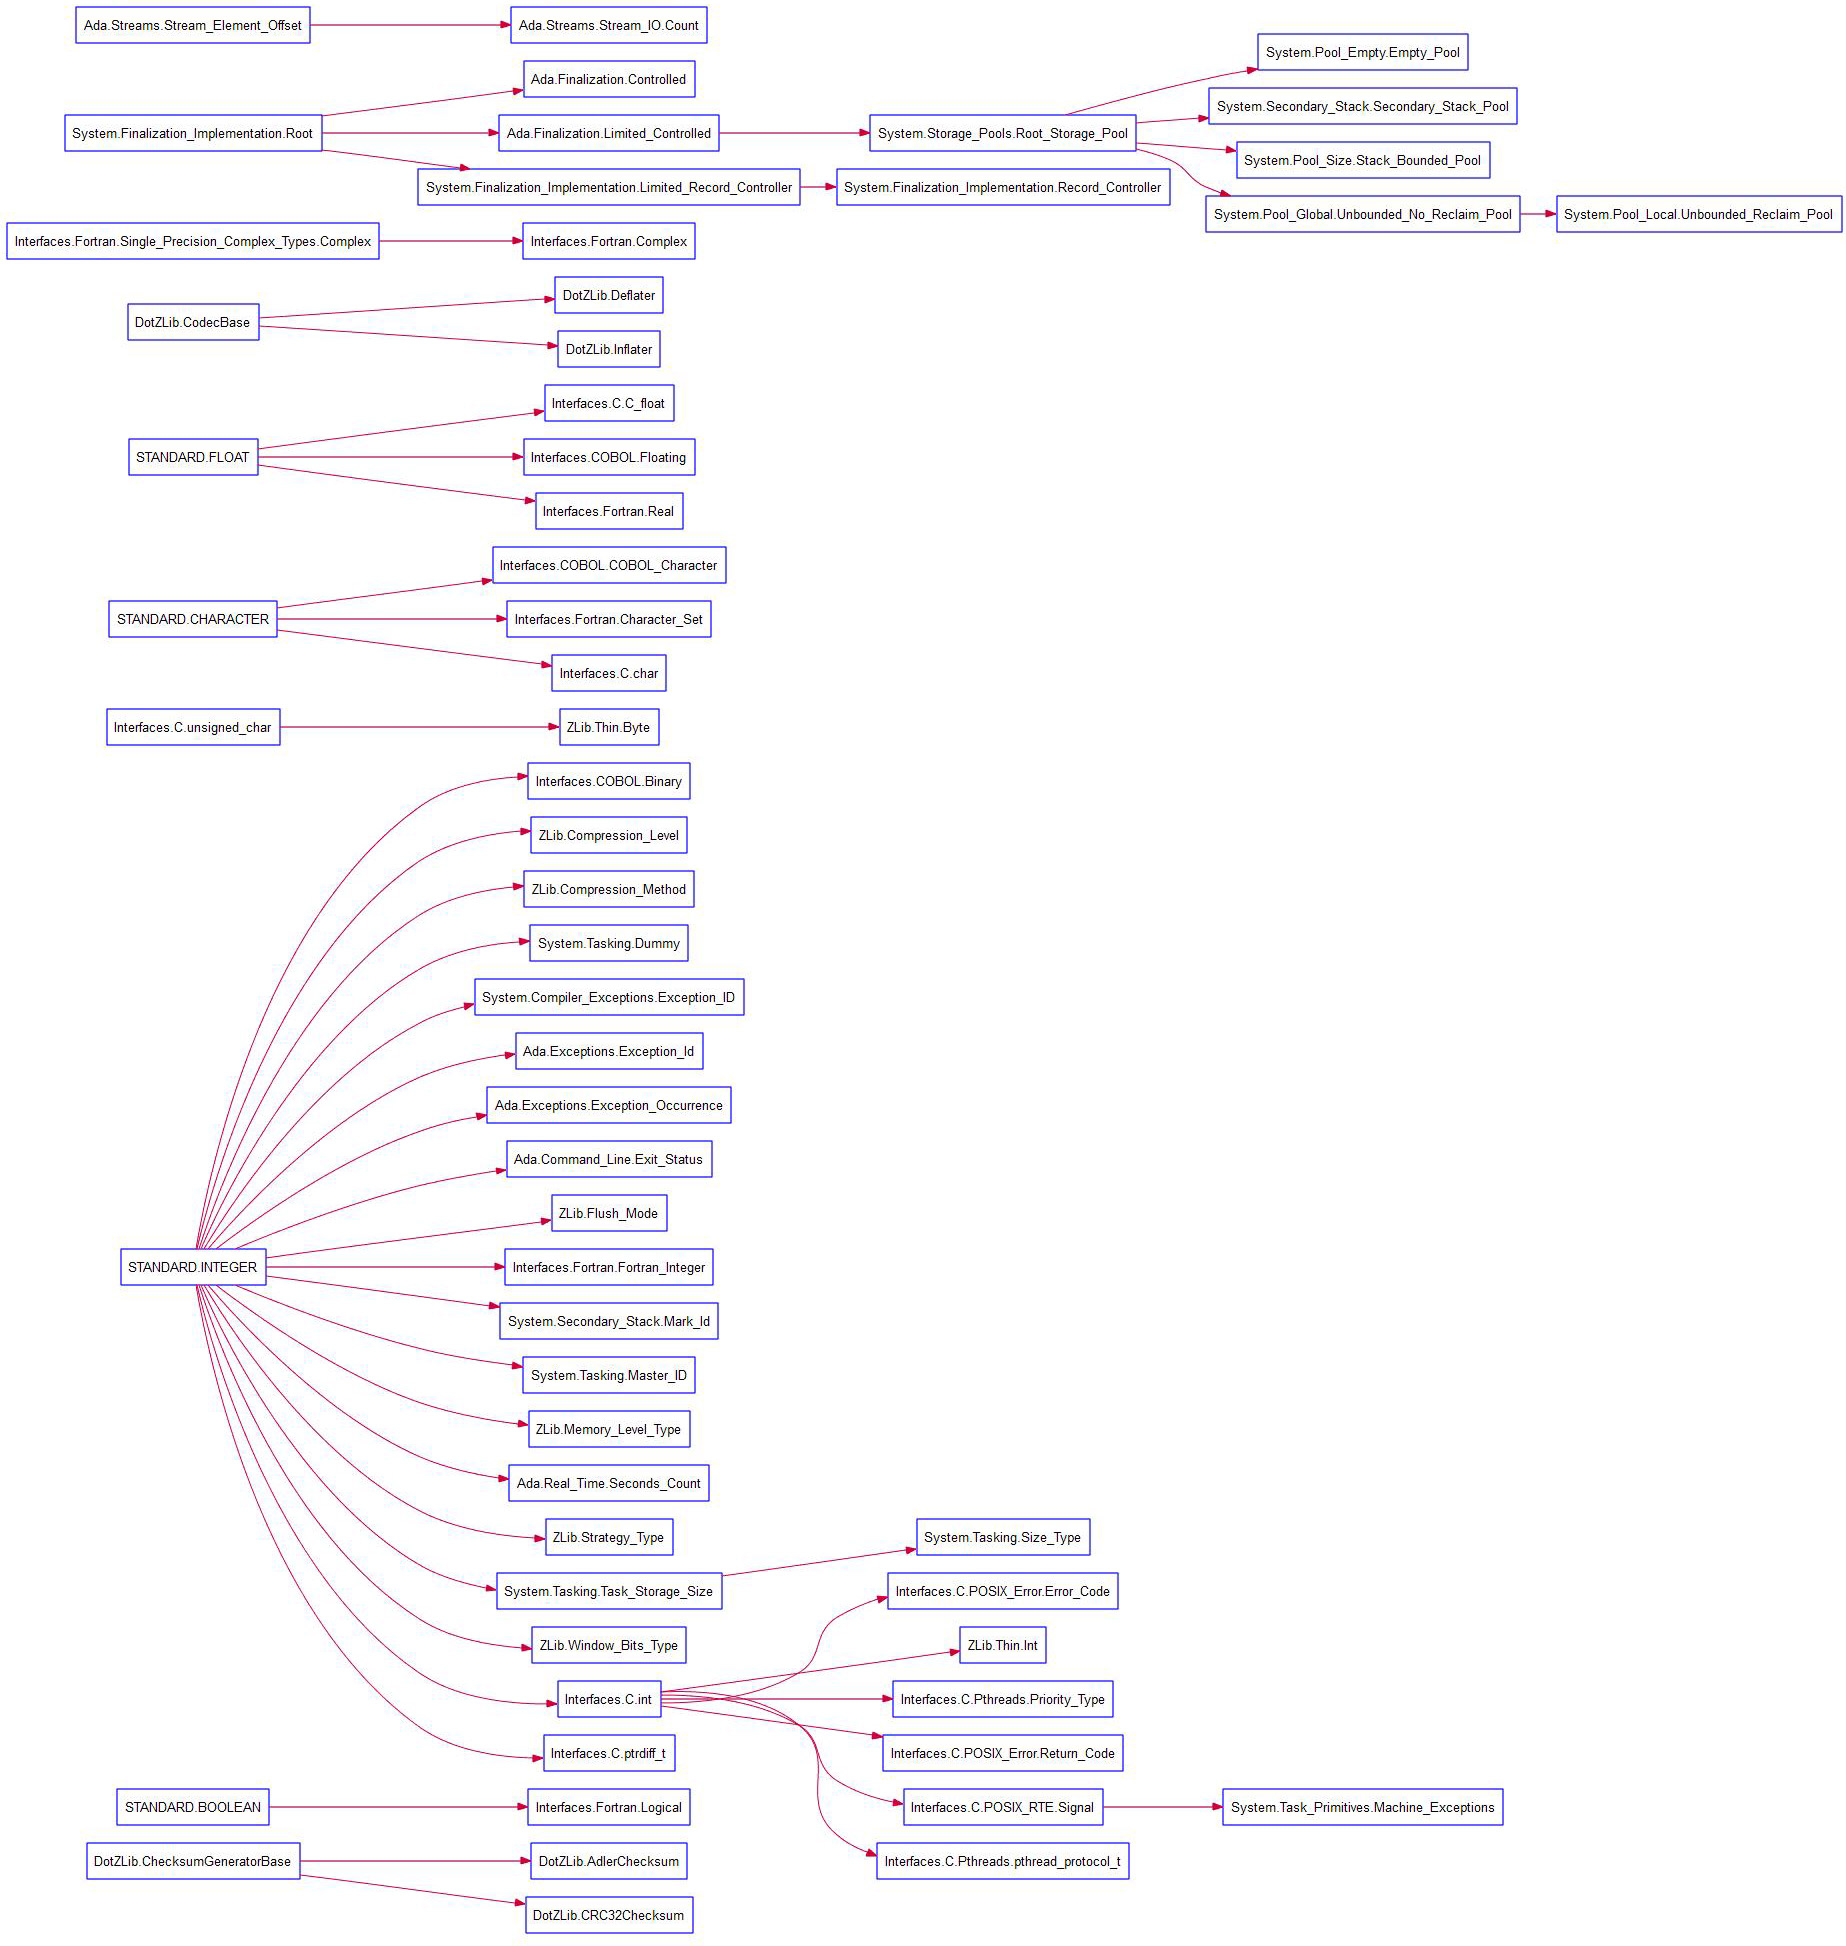
Example Hierarchical Graph (With Hiearchy) of an Ada Package:
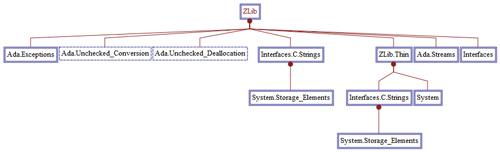
Note that layout has been altered and full names are shown
(this is configurable).
Control Flow Graphs
All of Understand's graphs can be configured in a myriad of
ways. They can also be copied to the clipboard, saved as an image, saved as a
vector image or saved directly to Visio for further editing.
Printing can be to a single sheet or divided among N sheets that are then pieced
together (poster printing). All graphs can be generated automatically via
scripts permitting easy update of "As Built" documentation.
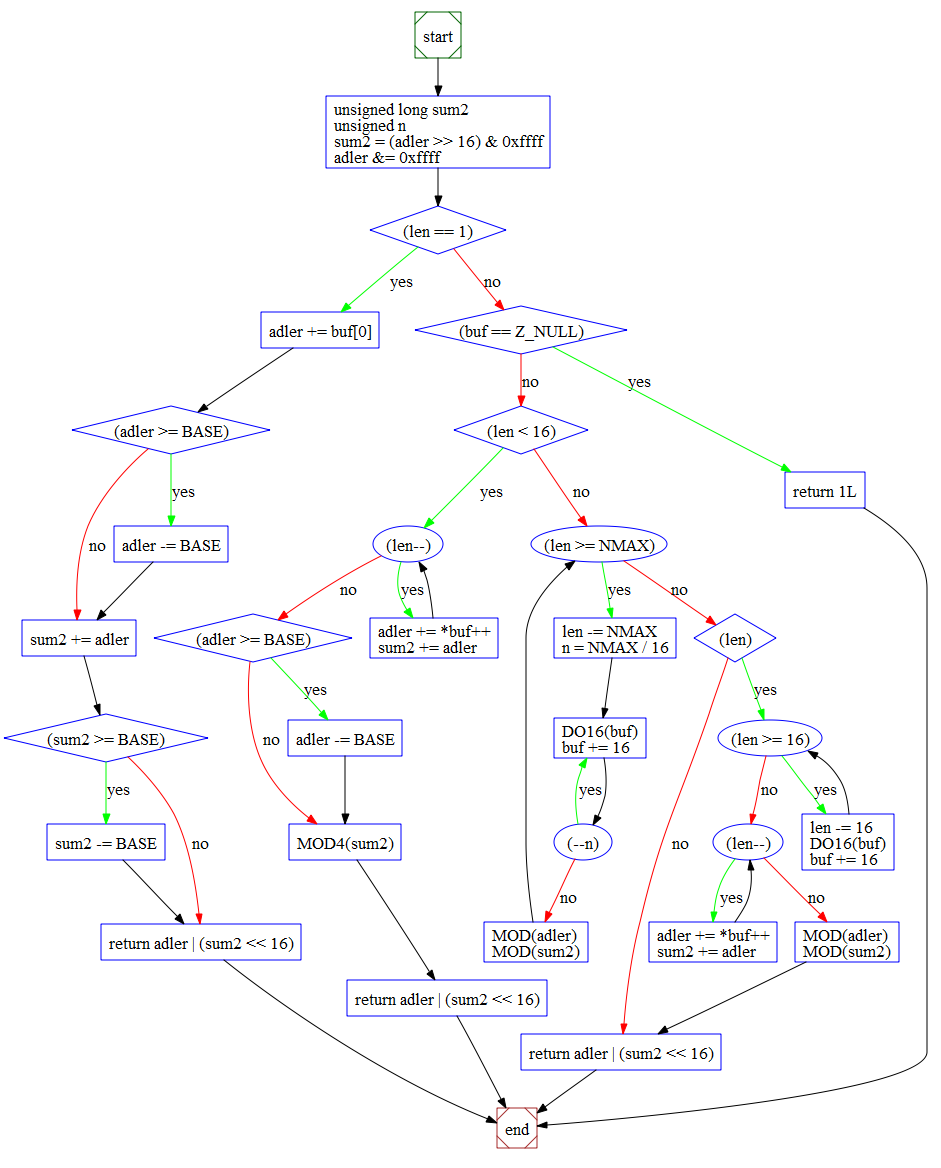
Example Control Flow Graph of a C++ function:
Dependency Graphs
Understand can generate graphs that show the hierarchy of an
architecture, or just a sub-hierarchy. These graphs can be saved as PNG, JPEG,
SVG, or they can be saved directly to Visio for further editing.
The dependency graphs include a customizer pane. This allows you to modify the
graph display by controlling expansion, highlighting, and arrows on a per-node
basis. Node children and Edges coming in and going out are easy to see and
identify using the customization provided.
For example, the following graph shows the files that are "depended on by" zlib\contrib
using red edges, and the files that zlib/contrib "depends on" with blue edges.
The dependencies for the other files are still visible, but are faded out to
allow easier viewing for the node you are interested in.
Each node that is drawn as a 3D box in the above image, can also be expanded to
show its child nodes, such as zlib/contrib and zlib/examples.
Detailed graph functionality can be seen in the Dependency
Graphs video.
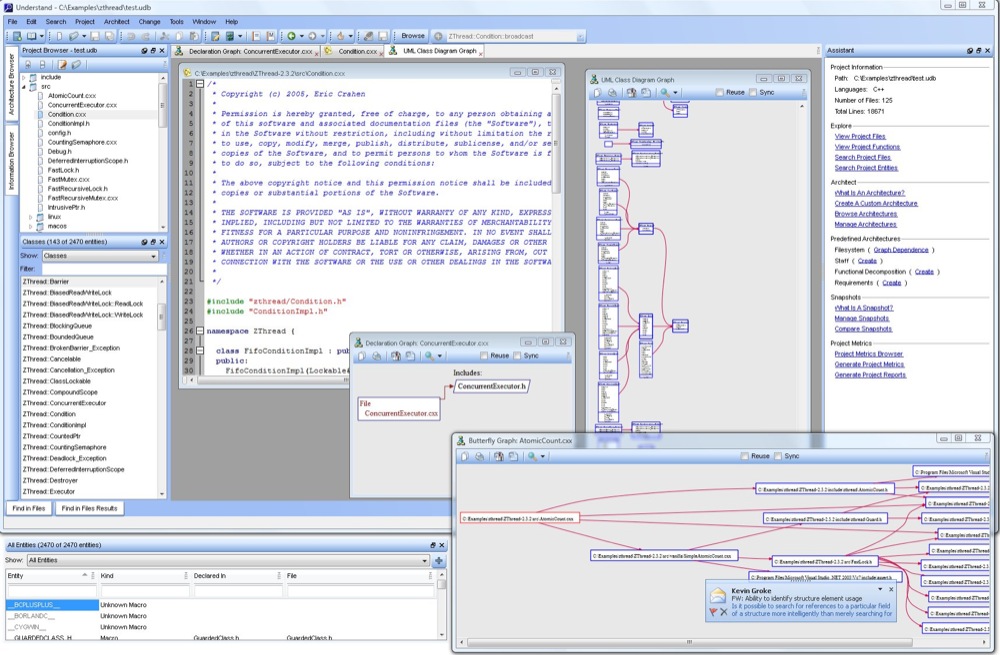
UML Class Diagram
Visually follow your classes using the UML Class Diagram.
The diagram can be viewed for a specific class of your choice:
or for your entire project:
Both diagrams have options to show the details of each class
and solo classes by simply right clicking in the white space of the diagram.
More information about the UML diagram.
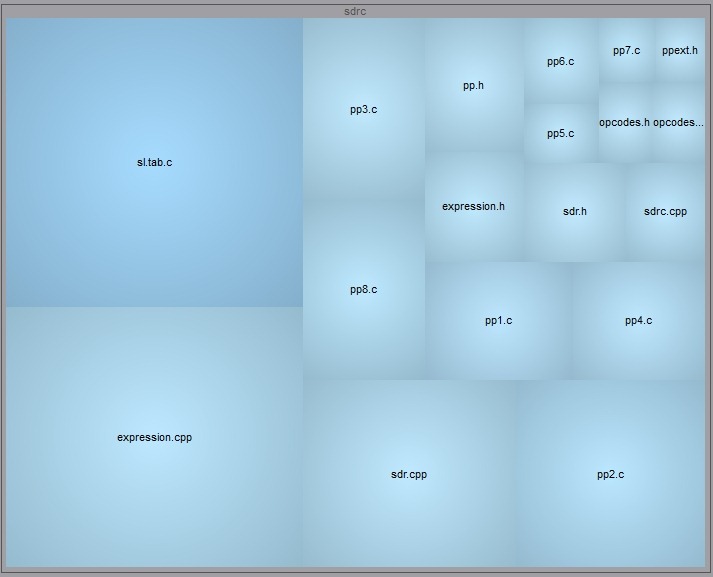
Treemaps
Treemaps are an area-based visualization where the size and
color of the area are visually representing a metric. This new Understand
feature allows the user to choose the metric they want to see.
This treemap has the metric CountLine tied to size. The color is tied to the
metric CountSemicolon.
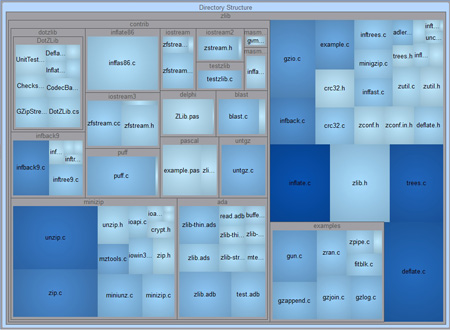
Example of sample project zlib that can be found in Understand
Custom Graphs
All of Understand's graphs can be configured in a myriad of
ways. They can also be copied to the clipboard, saved as an image, saved as a
vector image or saved directly to Visio for further editing.
Printing can be to a single sheet or divided among N sheets that are then pieced
together (poster printing). All graphs can be generated automatically via
scripts permitting easy update of "As Built" documentation.
Example Customized/Scripted Graph (Butterfly):
This is a scripted graph. The ability to draw graphs like this
is a core feature of the Understand PERL API. Using its UPL (Understand Plugin)
system we or advanced users can develop their own custom graphs addressing
specific information needs. In this case, it combines the call and callby tree
into a single view.
<Code Knowledge>
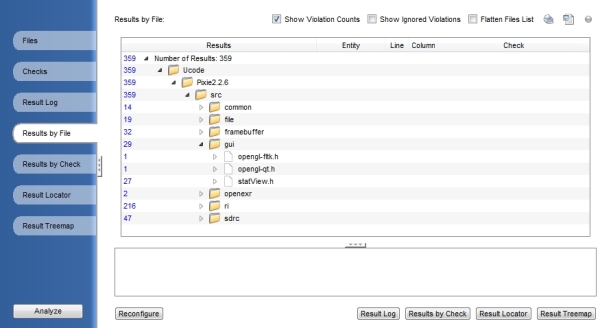
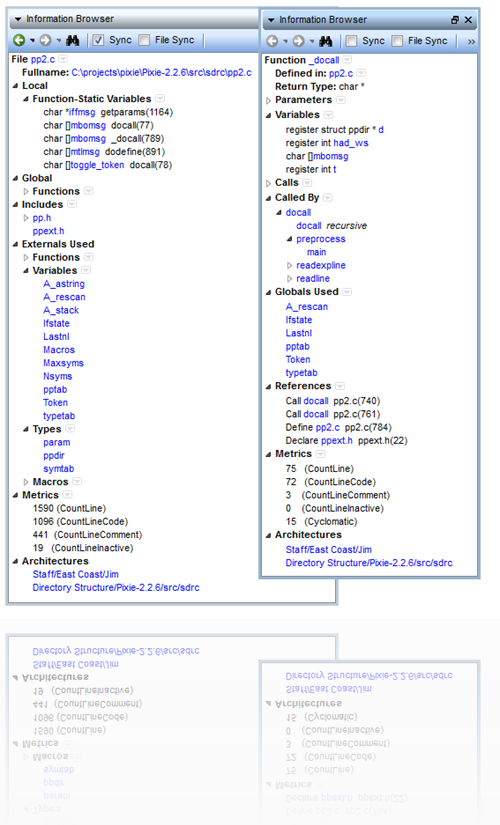
Information Browser
Just about everything Understand knows about code is shown in
the Information Browser (IB). The IB is used for all types of entities and it
shows different things depending on the type of entity selected. You can quickly
see information about all of its sub entities, what it uses and calls, some
basic metrics, and it even lets you see everywhere that an entity is used,
called, modified or interacted with. Information that is hierarchical in nature
(such as a call relationship) can be expanded multiple levels.
The Information Browser is always just two clicks away, right
click on any entity, even when browsing the source, and select View Information.
Below are sample Info Browser windows for a file and a C function:
Contextual Information
Understand pushes information to you as you move about the
editor in a source file. The place where the information is shown is the
Contextual Information Sidebar (CIS)
Let's take the acronym apart:
• C contextual. Context is wherever you are in
source code. In a file, at a line, inside a class, inside a method.
• I information. That is what Understand provides information about
code.
• S Sidebar. Hint look for the "context" "information" on the right
side of your editor.
The CIS watches where you are as you visit source code. It
pushes information about the file you are in and the scope you are in.
First the "File Context" area, which is divided into two tabs:
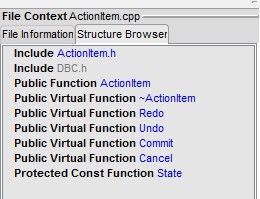
Structure Browser shows you the major parts of the file. In this case, Includes,
public functions, and so forth. It also highlights where you are in the editor
in the Structure Browser like a radar overview.
Next is the File Information tab:
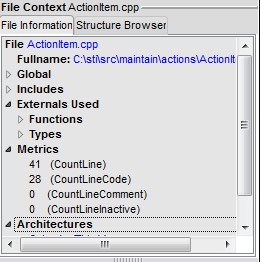
Looks familiar doesn't it. It is the Information Browser, but always for the
file you are editing. Note that how you configure the IB here, doesn't affect
how the others in the rest of the GUI work this one remembers just its settings.
Okay, so where ever you go, CIS tells you about the File you are in.
Now as you move about the file, your scope changes. Hence the second part,
"Scope Context".
Again, it is divided into two sections. The first, is the Scope Information
section, which is the Information Browser for the scope you are in:

Whatever scope you are in, the Scope Context IB shows you the Information
Browser for it. Auto-magically.
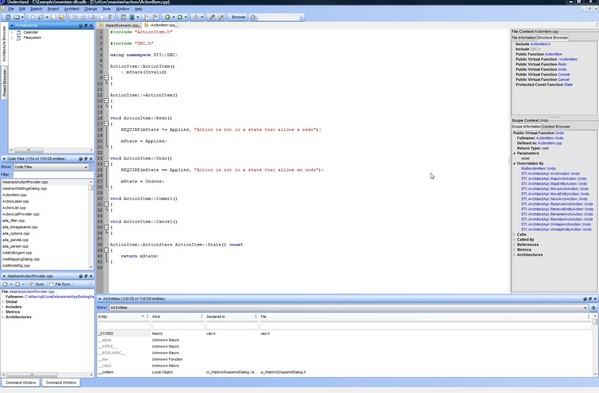
Next up is something pretty new. I'm quasi-proud of it, because I thought of it.
But a new engineer with Scitools, Rob Gempeler, implemented it. It is called the
"Context Browser". Its job is to always tell you where you are, with quick links
to higher scopes, AND, to provide a quick list of entities within a window of
your cursor.
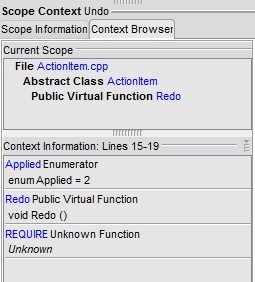
So above, we can see that when the cursor is at line 17, I'm in file
ActionItem.cpp, Class ActionItem, and Public Virtual Function "Redo". Further
more, as I look at that region of code:
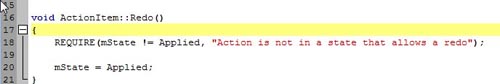
with a glance to the right I can see that "Applied" is an
enumerator 2, and REQUIRE is an unknown function (actually it is a macro I
forgot to define).
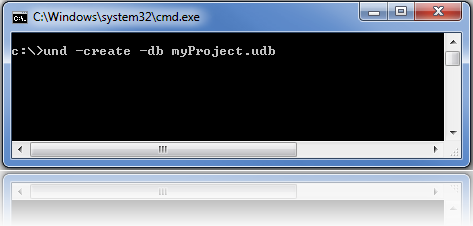
Automation
The command line tool und, included with Understand lets you quickly
create, parse, and report on Understand projects. If you have a large number of
projects you need to create, or need to automate reporting or metrics
generation, this is the perfect tool.
Many customers use und as part of their regular build process, whenever the
build is finished they run und to update their Understand project and then to
export the metrics associated with that version of code. All that can easily be
done in und with one line, e.g.
und -db c:\projects\myProject.udb -rescan -analyzeAll -metrics buildmetrics.csv
The Understand manual has more details about the und command and how to use it.
For the latest options run und help and dont hesitate to contact us if you have
any questions.
Perl API
Understand includes a full PERL API which allows you to
directly query the Understand database. If you want to create your own report,
or gather information in a manner that we did not foresee in Understand, you can
access the information yourself via the API. You can access the information
directly from within the Understand GUI, or query for it from the command line.
The executable uperl will allow you to run perl api commands directly against
the database. The scripts can be as simple or as complicated as you choose. Head
to the Plugins section to get started using the API, and we are happy to help if
you have any questions.
<Reports>
Cross Reference
Understand generates a wide variety of reports. The reports
available in your project may vary based off of the project language, but the
reports fall into these categories:
• Cross-Reference reports show information similar to that
in the Info Browser, except that all entities are shown together in alphabetic
order.
• Structure reports show the structure of the analyzed
program.
• Quality reports show areas where code might need to be
examined.
• Metrics reports show basic metrics such as the number of
lines of code and comments.
Cross Reference Reports
Cross-Reference reports show information similar to that in
the References section of the Info Browser, except that all entities are shown
together in alphabetic order.
• Data Dictionary Report - The Data Dictionary Report lists all
entities alphabetically. Each listing shows the entity name, what kind of entity
it is (for example, macro, type, variable, function, include, file, or
procedure), along with links to the location where each is declared in the
source code.
• Program Unit Cross-Reference Report - The Program Unit
Cross-Reference Report lists all program units (such as procedures and
functions) analyzed in alphabetic order along with information about what they
return (if anything), what parameters are used, and where they are used by other
program units. The HTML version offers hyperlinks to the Data Dictionary report
entry and to the source code where each reference occurs.
• File Contents Report - Lists functions declared within a source
file and the line numbers where they are declared. HTML versions of this report
permit hyperlinked jumping to the function in the source as well as viewing of
the entire source file.
• Object Cross-Reference Report - Lists functions declared within a
source file and the line numbers where they are declared. HTML versions of this
report permit hyperlinked jumping to the function in the source as well as
viewing of the entire source file. Lists functions declared within a source file
and the line numbers where they are declared. The HTML versions of this report
permit hyperlinked jumping to the function in the source as well as viewing of
the entire source file.
• Type Cross-Reference Report - The Type Cross-Reference Report
lists all declared types in alphabetic order, along with their declaration and
usage information. The HTML version of the report offers hyperlinks to the Types
data dictionary report entry, as well as the source code where the reference
occurs.
• Class and Interface Cross-Reference - The Class and Interface
Cross-Reference Report lists all declared classes and interfaces in alphabetic
order, along with their declaration and usage information. The HTML version of
the report includes hyperlinks to the data dictionary report entries, as well as
the source code where the reference occurs.
• Macro Cross-Reference - The Macro Cross-Reference Report lists
all macros analyzed in the source code in alphabetic order along with
information about where they are declared and where they are used. The HTML
version offers hyperlinks to the macros Data Dictionary report entry and to the
source code where each reference occurs.
• Include File Cross-Reference - The Include File Cross-Reference
Report lists all include files analyzed in the source code in alphabetic order
with information about which files include them. The HTML version offers
hyperlinks to the source code where each reference occurs.
• Exception Cross-Reference Report - The Include File
Cross-Reference Report lists all include files analyzed in the source code in
alphabetic order with information about which files include them. The HTML
version offers hyperlinks to the source code where each reference occurs.
Structure Reports
Structure reports are designed to help you understand the
relationships between various entities.
• Declaration Tree - The Declaration Tree shows the declaration
nesting of each program unit analyzed. In the HTML version of the report each
program unit name is a hyperlink to its entry in the Program Unit
Cross-Reference Report.
• Class Extend Tree - The Class Extend Tree report shows the
nesting of class declarations in the files analyzed. In the HTML version of the
report each class name is a hyperlink to its entry in the Data Dictionary and
Interface Cross-Reference Report.
• Invocation Tree Report - The Invocation Tree Report shows a
textual representation of the invocation tree for each program unit analyzed.
The report shows who each program unit calls. The HTML version offers hyperlinks
to the corresponding Data Dictionary report entries.
• Simple Invocation Tree Report - The Simple Invocation Tree Report
shows the invocation tree to only one level for each program unit that has been
analyzed.
• With Tree Report - Structured identically to the other hierarchy
reports, the With Tree report shows a textual representation of the With Tree
for each program unit that is not Withed by another.
• Simple With Tree Report - The Simple With Tree report is similar
to the With Tree report. It shows a textual representation of the With Tree for
each program unit that is not Withed by another. However, it shows only one
level of withs.
• Generic Instantiation Report - This report lists each package
that was created through instantiation. In the HTML version, the source where it
was instantiated and its Data Dictionary Report entry may be visited from
hyperlinks.
• Renames Report - The Renames Report cross-references the use of
the Ada command renames. This report lists program units that have been renamed
in alphabetic order. Each rename shows the program unit it renames, and in the
HTML report a hyperlink to the rename instance in the source is provided. The
Info Browser also identifies packages and program units that rename others or
are renamed.
• Import Report - The Import report lists all source files that
import other files and the files they import. The HTML version offers hyperlinks
to the data dictionary entry for each imported file.
Quality Reports
Understands quality reports are designed to provide
information about areas of the analyzed source that might not meet standards or
that hold the potential for trouble. They also identify areas where extra
programming has been done but not needed. This sometimes identifies areas that
arent yet complete, or that havent been maintained completely.
• Program Unit Complexity Report - Lists every procedure and
function or similar program unit in alphabetic order along with the McCabe (Cyclomatic)
complexity value for the code implementing that program unit. The Cyclomatic
complexity is the number of independent paths through a module. The higher this
metric the more likely a program unit is to be difficult to test and maintain
without error. It also reports the maximum nesting level of control constructs
in each program unit.
• FORTRAN Extension Usage Report - This report lists anywhere your
source code has non-standard FORTRAN extensions. The report factors in what
variant (F77, F90, F95) you chose on your project configuration.
• Implicitly Declared Objects Report Reports any variables or
parameters that were implicitly declared using FORTRANs implicit declaration
mode. Using implicitly declared variables is considered a risky practice, and
this report helps you weed out where the practice is occurring in your code. The
HTML version offers hyperlinks to the functions Data Dictionary report entry.
• Uninitialized Items - Lists items such as variables that are not
initialized in the code. The report is organized by file. The HTML version
offers hyperlinks to the location where the item is declared.
• Unused Variables and Parameters Reports items that are declared
(and perhaps initialized) but never referenced other than that. The report is
organized by file. Types of items may include functions, parameters, variables,
and objects. The HTML version offers hyperlinks to the location where each
unused item is declared.
• Unused Objects Report - Shows objects (for example, variables,
parameters, constants) that are declared but never used. The HTML version has
links to the functions Data Dictionary report entry and to the source line where
the object is declared.
• Unused Types Report Displays types that are declared but never
used. The HTML version has links to the functions Data Dictionary report entry
and the source where the type is declared.
• Unused Program Units Report - The Unused Program Units Report
identifies program units that are declared but never used. Note that this
listing in this report doesnt mean the system doesnt need this program unit. For
instance, interrupt handlers that are called by system interrupts are often
never used within the other source of the program.
• Withs Not Needed Report - This report lists, any With statements
a program unit has but does not need (by not using items made public by the With
statement). Note that this covers only direct usage in the program unit and
doesnt account for side effects that may be needed by the program to operate
correctly. For instance, sometimes a package can be Withed just to start a task
or to execute code in its begin/end block.
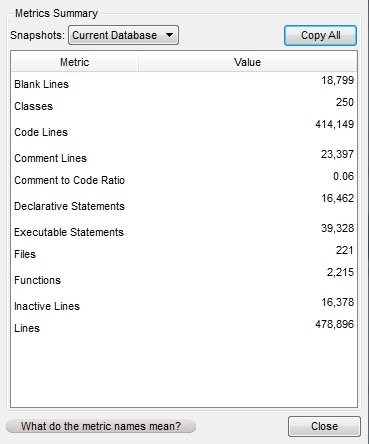
Metrics Reports
Metrics provide statistical information about your project and
entities, such as the number of lines of code and the complexity of various
entities.
Understand provides a number of ways to gather metrics information. This section
describes reports that provide metrics, see Metrics for other ways to gather
metrics and a full list of the metrics available in Understand.
• Project Metrics Report - The Project Metrics Report provides
metric information about the entire project. The metrics reported include: the
total number of files, the total number of program units, and the total number
of lines of source code.
• Class Metrics Report - The Class Metrics Report provides the
following metrics for each class that has been analyzed:
◦ Total number of lines
◦ Total number of blank lines
◦ Total number of lines of code
◦ Total number of lines that contain comments
◦ Average number of lines per class
◦ Average number of comment lines per class
◦ Average complexity per class
◦ Maximum complexity within class
◦ Ratio of comment lines to code lines
• Class OO Metrics Report - The Class OO Metrics Report provides
the following object-oriented metrics for each class that has been analyzed:
◦ LCOM (Percent Lack of Cohesion): 100% minus the
average cohesion for class data members. A method is cohesive when it performs a
single task.
◦ DIT (Max Inheritance Tree): Maximum depth of the
class in the inheritance tree.
◦ IFANIN (Count of Base Classes): Number of immediate
base classes.
◦ CBO (Count of Coupled Classes): Number of other
classes coupled to this class.
◦ NOC (Count of Derived Classes): Number of immediate
subclasses this class has.
◦ RFC (Count of All Methods): Number of methods this
class has, including inherited methods.
◦ NIM (Count of Instance Methods): Number of instance
methods this class has.
◦ NIV (Count of Instance Variables): Number of instance
variables this class has.
◦ WMC (Count of Methods): Number of local methods this
class has.
• Program Unit Metrics Report - The Program Unit Metrics Report
provides information on various metrics for each program unit that has been
analyzed.
◦ Lines: Total number of lines in the function.
◦ Comment: Number of comment lines in the function.
◦ Blank: Number of blank lines in the function.
◦ Code: Number of lines in the function that contain
any code.
◦ Lines-exe: Lines of code in the function that contain
no declaration.
◦ Lines-decl: Lines of code in the function that
contain a declaration or part of a declaration.
◦ Stmt-exe: Number of executable statements in the
function.
◦ Stmt-decl: Number of declarative statements in the
function.
◦ Ratio Comment/Code: Ratio of comment lines to code
lines. (comment_lines/code_lines)
• File Metrics Report - The File Metrics Report provides
information similar to that in the Program Unit Metrics Report. However, it is
organized by file rather than by program unit.
• File Average Metrics Report - The File Average Metrics Report
provides averages for the functions within a file. All lines outside any
function are ignored when calculating the averages. The following metrics are
provided for each function:
◦ McCabe Cyclomatic: The average number of independent
paths through the functions in this file. The higher this metric the more likely
a program unit is to be difficult to test and maintain without error.
◦ Modified: Same as McCabe Cyclomatic complexity except
that each case statement is not counted; the entire switch statement counts as
1.
◦ Strict: Same as McCabe Cyclomatic complexity except
that && and || also count as 1.
◦ Essential: Measures the amount of unstructured code
in a function.
◦ Lines: Average number of lines in the functions in
this file.
◦ Code: Average number of lines that contain any code
in the functions in this file.
◦ Comment: Average number of comment lines in the
functions in this file.
◦ Blank: Average number of blank lines in the functions
in this file.
Custom Reports
The reports included with Understand have evolved over many years to accommodate
common customer requests. However, we recognize that not all needs can be
covered.
To help you develop custom reports there is a full Perl API interface to the
Understand database as well as a full developed plugin mechanism. For example
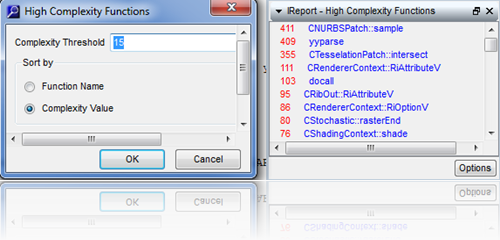
the custom report plugin below lists the most complex function in your project,
based off of Cyclomatic complexity.
For details on the PERL API and using and developing plugins, visit the Plugins
section. The Forum is also a good place to ask questions if you need help.