Time series percentiles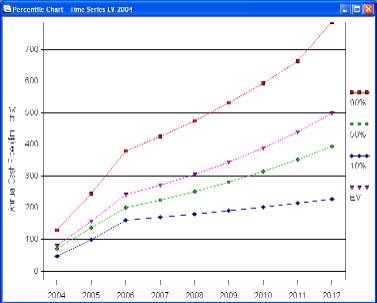
Often it is important to not only know the degree of risk you are taking in a
venture but how that risk evolves over time. Time Series Percentiles provide you
with a view of how the uncertainty in key performance measures such as free cash
flow change during the life of a project.
Multiple attributes
DPL Professional allows you to define multiple attributes. These may be
different value measures (for example, cost, jobs, environmental contamination),
or different metrics in a financial framework (NPV, IRR, earnings, etc.). You
can obtain a full risk profile on any (or all) of the attributes.
Arrays and series in the influence diagram
DPL Professional allows you to define one- and two-dimensional array value nodes
as well as simple scalars. Array value nodes can be very convenient when linking
to Excel spreadsheets where the assumptions to be tested are rows or ranges
rather than single cells.
The Endpoint Database™
With DPL's Endpoint Database™, you can record the values of all the attributes
at each endpoint (leaf node). Once recorded, the database can be replayed,
without costly recalculation of a linked spreadsheet, even if the DPL model has
been changed. You only need to perform a full recalculation when you change the
spreadsheet or increase the number of endpoints (e.g., by adding chance nodes).
Option value charts
DPL users interested in real
options have
long produced "waterfall" charts showing the incremental value of flexibility
("options value") for the downstream decisions ("real options") in a decision
tree. DPL produces this output for you automatically.
Advanced tornado diagrams
DPL Professional includes Event tornado diagrams. Unlike simple Base Case or
Value tornadoes, Event tornadoes make full use of probabilities and even
conditional relationships in the influence diagram, to give you a more complete
picture of the contribution of individual uncertainties to overall risk.
DPL programs and Excel spreadsheet conversion
Drag and drop model building is the way to go for the vast majority of decision
models. Still, some difficult problems cry out for the power of a text-based
modelling environment. DPL Professional gives you the option.
While most DPL users don't write DPL programs, DPL Professional has a unique
facility for translating Excel spreadsheets into DPL's language. A decision
model linked to a converted spreadsheet may run 10 or even 100 times faster than
one linked to a live spreadsheet recalculated by Excel.
Scenario risk profiles
Have you ever gestured at a branch in the Policy Tree&Trade; and wondered how
much downside risk remained from that point onward? With DPL Professional, the
answer to that question is just two clicks away. DPL can produce a risk profile
starting from any point in the policy tree (that is, assuming the events to the
left of that point are fixed in the states that lead there).


