[Overview]
We are pleased to announce the immediate availability of GeoStudio 2012.
Using GeoStudio 2012 will enhance your workflow and productivity, as well as
broaden the types of engineering problems you can analyze.
Together with GeoStudio 2012 and in response to many customer requests, we are
also pleased to announce a new Annual Maintenance program. Purchasing Annual
Maintenance will provide you with a year of software updates, technical support,
and other benefits, including any major version upgrades.
GeoStudio 2012 incorporates enhancements to each product in the GeoStudio suite,
including:
Improved Solvers
 Each
Solver has been directly integrated into GeoStudio via a new Solver Manager
window. This lets you monitor the progress of the Solvers without leaving the
GeoStudio environment.
Each
Solver has been directly integrated into GeoStudio via a new Solver Manager
window. This lets you monitor the progress of the Solvers without leaving the
GeoStudio environment.
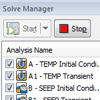
Each analysis is verified automatically before solving, and any errors are
reported immediately. While solving, you can see the solution status of each
analysis, check the analyses that you wish to solve, and stop the Solver. Errors
encountered by the Solver are reported in the window.
Solver speed has been improved for all products, particularly when you solve
multiple analyses simultaneously. The SLOPE/W Solver has been totally revamped
to taking advantage of modern multi-core processors. This results in significant
speed increases, particularly for probabilistic and Newmark analyses.
Improved Convergence
The finite element convergence schemes have been improved, allowing for
faster solve times and more reliable convergence that is easier to understand.
Improved under-relaxation schemes allow you to obtain solutions for highly
non-linear problems. The review boundary process has also been improved,
frequently reducing the number of review loops required.
You can monitor the convergence history directly in Results view after each time
step has completed by plotting the number of unconverged nodes for each
iteration or time step.
 Improved
Modeling Environment
Improved
Modeling Environment
New docking windows in GeoStudio 2012 allow you to view information in
multiple views so you can quickly access the data you need. You can customize
the display of docking windows to suit your particular needs. A new status bar
provides both view information and quick access to commands such as zooming, and
a progress bar during lengthy operations such as solving.
Watch a movie showing the new docking window support in GeoStudio:
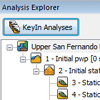
Docking windows include an Analysis Explorer, Solve Manager, Result Times, Slip
Surfaces, and Sensitivity Runs.
- The Analysis Explorer displays a tree view of the analyses in the
project, allowing you to quickly change the analysis you are viewing.
- The Solve Manager allows you to solve one or more analyses and watch
their progress even while continuing to work on another analysis.
- The Result Times window displays a list of time steps that have computed
results. When you select a time step, all currently displayed views and
dialog boxes show the results computed for the selected time.
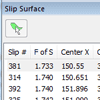
- The Slip Surfaces window displays a list of SLOPE/W computed trial slip
surfaces. When you select a slip surface, the Results view will show the
complete slip surface results. If detailed results are unavailable,
GeoStudio will compute them on-demand, allowing you to view detailed forces
or graphs on any particular slip surface without having to designate it as a
"critical" slip surface.
- The Sensitivity Runs window displays a list of runs performed for a
sensitivity analysis. Each sensitivity run is now a complete slope stability
analysis, allowing you to view all computed slip surface results for each
individual run.
 Improved
Viewing of Results
Improved
Viewing of Results
Results are now automatically displayed when you start solving a GeoStudio
problem. Graphing results over time can be done as soon as each time step is
computed, without waiting for the Solver to finish. These graphs can also now be
generated as much as 20 times faster than in previous versions, and additional
SLOPE/W graphs have been added.
SLOPE/W results can now include computed finite element data. For example, you
can show the critical slip surface on top of pore-water pressure contours,
stress contours, or the liquefaction zone. You can also show color gradients
when plotting factor of safety contours over the grid of slip surface centers.
 Improved
Probabilistic and Sensitivity Analyses
Improved
Probabilistic and Sensitivity Analyses
SLOPE/W Probabilistic analyses can now be done on every trial slip surface,
resulting in an improved understanding of the overall risk of failure. Likewise,
each sensitivity run can be analyzed in detail, allowing you to view all slip
surface information for all sensitivity runs.
Both probabilistic and sensitivity parameters are applied separately for each
analysis, allowing you to set up multiple scenarios within the same project. You
can apply probability or sensitivity to any pore-water pressure option, not only
piezometric lines.
 Improved
Licensing and Delivery
Improved
Licensing and Delivery
GeoStudio 2012 is now being delivered to you completely electronically,
without any physical packaging. This eliminates your shipping costs, speeds up
and simplifies the purchasing process, and is more eco-friendly! All GeoStudio
resources, including engineering books, are digitized and available online.
Full-color printed books can be ordered separately as required.
Stand-alone licenses no longer require a hardware dongle attached to your
computer; you simply activate your computer to use your GeoStudio license. To
use your GeoStudio license on a different computer, you can transfer your
activation to that computer.
Network licenses are now controlled using a new license server with a web-based
monitoring interface. Network licenses can be "re-hosted" onto new server
hardware using an included activation utility.
 Automate
GeoStudio with GeoCmd
Automate
GeoStudio with GeoCmd
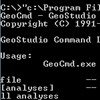
GeoCmd is a new command-line utility that makes it more convenient to work
with large numbers of data files. You can automate GeoStudio to solve, upgrade,
or generate reports for many project files sequentially.
Save Files in GeoStudio 2012 or 2007 Format
Files created in GeoStudio 2012 can be saved as GeoStudio 2007 files,
allowing you to continue working with other members of your team who have not
yet upgraded.
Additional Enhancements
Many other improvements have been made in GeoStudio 2012, including:
- SLOPE/W results are now stored in standard CSV files, making it easier
to import results into a spreadsheet for further analysis.
- SLOPE/W analyses now focus on a single method, making it easier to
navigate results. The GLE method is now directly incorporated into the
Spencer and Morgenstern-Price methods, allowing you to display factor of
safety verses lambda plots for these methods to understand convergence.
- SLOPE/W Reinforcement properties have been changed to match
industry-standard nomenclature.
- SLOPE/W now contains a "High Strength" material model, making it easier
to model impenetrable structures such as concrete retaining walls.
- You can now specify the SLOPE/W residual water content directly;
previously, it was assumed to be 10%.
- Meshing improvements result in better element shapes, especially in
complex regions.
- GeoStudio takes less time to start; several key commands and dialog
boxes also have speed improvements.
- GeoStudio Add-Ins now support Microsoft .NET 4.0 and Visual Studio 2010.
- Sketch lines can now be shown in color.
- Sketch axis label coordinates are now shown as actual values, not with
"x 1000" labels.
Bug Fixes
Many bug fixes have been made throughout all products to improve performance
and stability.
[SLOPE/W
2012]
slope stability analysis
SLOPE/W is the leading slope stability CAD software product for computing the
factor of safety of earth and rock slopes. SLOPE/W can effectively analyze both
simple and complex problems for a variety of slip surface shapes, pore-water
pressure conditions, soil properties, analysis methods and loading conditions.
Using limit equilibrium, SLOPE/W can model heterogeneous soil types, complex
stratigraphic and slip surface geometry, and variable pore-water pressure
conditions using a large selection of soil models. Slope stability analyses can
be performed using deterministic or probabilistic input parameters. Stresses
computed by a finite element stress analysis may be used in addition to the
limit equilibrium computations, for the most complete slope stability analysis
available.
With this comprehensive range of features, SLOPE/W can be used to analyze almost
any slope stability problem you will encounter in your geotechnical, civil, and
mining engineering projects.
<Easy to Use>
Defining a Stability Model
Beginning an analysis is as simple as defining the geometry by drawing regions
and lines that identify soil layers, or by importing a DXF™ file. Then choose an
analysis method, specify soil properties and pore-water pressures, define
reinforcement loads, and create trial slip surfaces.
Viewing the Analysis Results
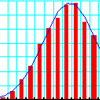
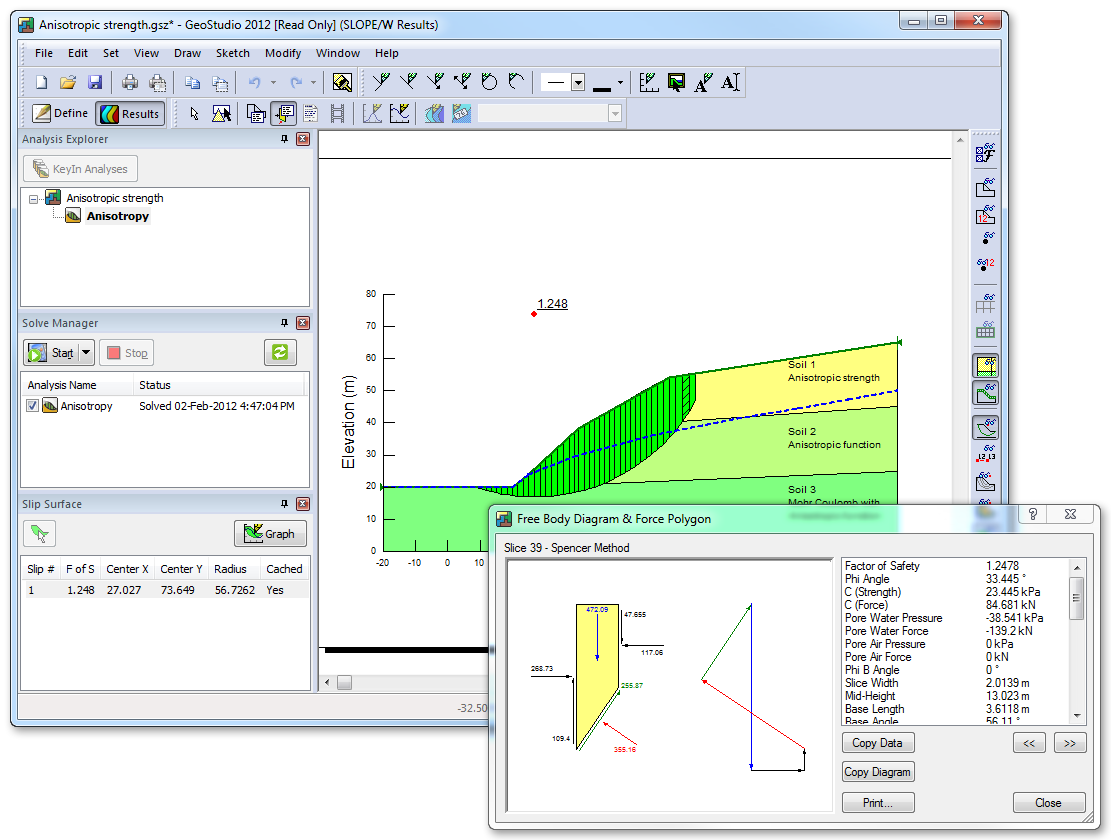
Once you have solved your stability analysis, SLOPE/W offers many tools for
viewing the results. Display the minimum slip surface and factor of safety, or
view each one individually. View detailed information about any slip surface,
including the total sliding mass, a free body diagram and a force polygon
showing the forces acting on each slice. Contour the factors of safety, or show
plots of computed parameters. Then prepare the results for your report by adding
labels, axes, and pictures, or export the results into other applications such
as Microsoft® Excel® for further analysis.
<Typical Applications>
SLOPE/W can model almost any stability problem, including:
-
Natural earth and rock slopes
-
Sloping excavations
-
Earth embankments
-
Open-pit high walls
-
Anchored retaining structures
-
Berms at the toe of a slope
-
Surcharges at the top of a slope
-
Earth reinforcement, including soil nails and geofabrics
-
Seismic and earthquake loading
-
Tension cracks
-
Partial and total submergence
-
Line load at any point
-
Unsaturated soil behavior
[SEEP/W 2012]
ggroundwater seepage analysis.
SEEP/W is a finite element CAD software product for analyzing groundwater
seepage and excess pore-water pressure dissipation problems within porous
materials such as soil and rock. Its comprehensive formulation allows you to
consider analyses ranging from simple, saturated steady-state problems to
sophisticated, saturated/unsaturated time-dependent problems. SEEP/W can be
applied to the analysis and design of geotechnical, civil, hydrogeological, and
mining engineering projects.
SEEP/W can model both saturated and unsaturated flow, a feature that greatly
broadens the range of problems that can be analyzed. In addition to traditional
steady-state saturated flow analysis, the saturated/unsaturated formulation of
SEEP/W makes it possible to analyze seepage as a function of time and to
consider such processes as the infiltration of precipitation. The transient
feature allows you to analyze such problems as the migration of a wetting front
and the dissipation of excess pore-water pressure.
<Easy to Use>
Defining a Seepage/Air flow Model
Beginning an analysis is as simple as defining the geometry by drawing regions
and lines that identify soil layers, or by importing a DXF™ file. Then
graphically apply boundary conditions and specify material properties. Material
properties can be estimated from easily measured parameters like grain-size,
saturated conductivity, saturated water content, and the air-entry value.
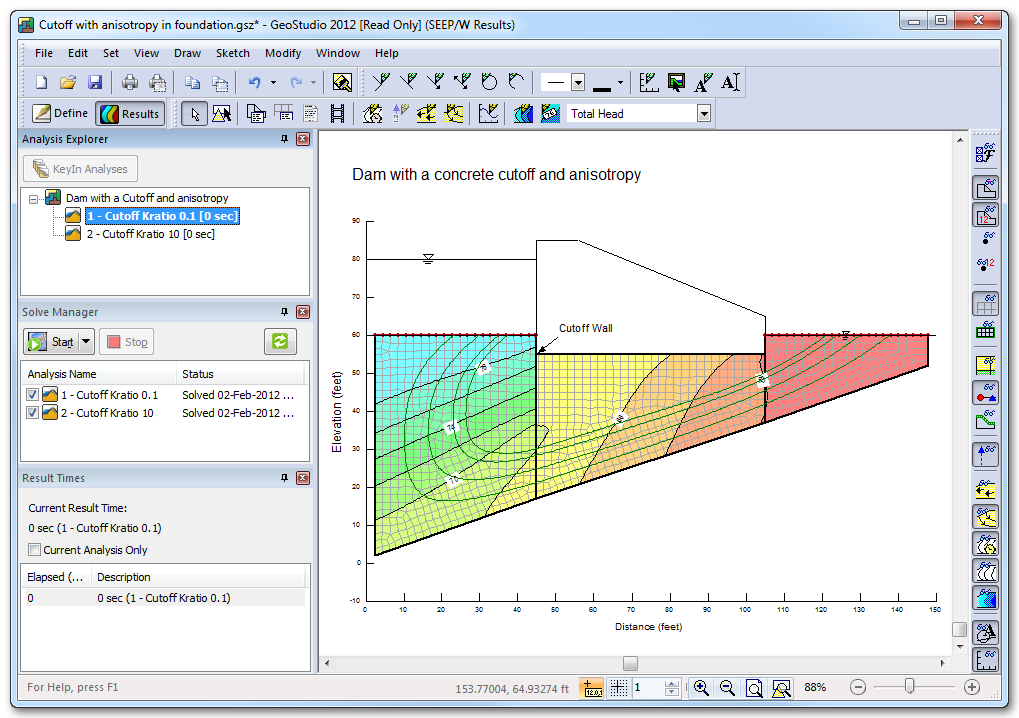
Viewing the Analysis Results
Once you have solved your seepage analysis, SEEP/W offers many tools for viewing
results. Generate contours or x-y plots of any computed parameter, such as head,
pressure, gradient, velocity, and conductivity. Velocity vectors show flow
direction and rate. Transient conditions can be shown as a changing water table
over time. Interactively query computed values by clicking on any node, Gauss
region, or flux section. Then prepare the results for your report by adding
labels, axes, and pictures, or export the results into other applications such
as Microsoft® Excel® for further analysis.
<Typical Applications>
SEEP/W can model almost any groundwater problem, including:
- Dissipation of excess pore pressure after reservoir drawdown
- Changes in pore-water pressure conditions within earth slopes due to
infiltration of precipitation
- Mounding of the groundwater table beneath water retention structures
such as lagoons and tailings ponds
- Effect of subsurface drains and injection wells
- Drawdown of a water table due to pumping from an aquifer
- Seepage flow quantities into excavations
- Use AIR/W and consider the true matric suction (Ua-Uw) mechanisms
- Integrate with TEMP/W and consider flow in freezing and thawing soils
[SIGMA/W
2012]
stress-deformation analysis.
SIGMA/W is a finite element CAD software product
that can be used to perform stress and deformation analyses of earth structures.
Its comprehensive formulation makes it possible to analyze both simple and
highly complex problems. SIGMA/W can perform a simple linear elastic deformation
analysis or a highly sophisticated, nonlinear elastic-plastic effective stress
analysis.
The many constitutive soil models allow you to represent a wide range of soils
or structural materials. In addition, when coupled with SEEP/W, SIGMA/W can
model the pore-water pressure generation and dissipation in a soil structure in
response to external loads.
These features enable SIGMA/W to analyze almost any stress or deformation
problem you will encounter in geotechnical, civil, and mining engineering
projects.
<Easy to Use>
Defining a Stress-Deformation Model
Beginning an analysis is as simple as defining the geometry by drawing regions
and lines that identify soil layers, or by importing a DXF™ file. Then
graphically apply boundary conditions and specify material properties,
structural elements, trusses, and fill or excavation layers.
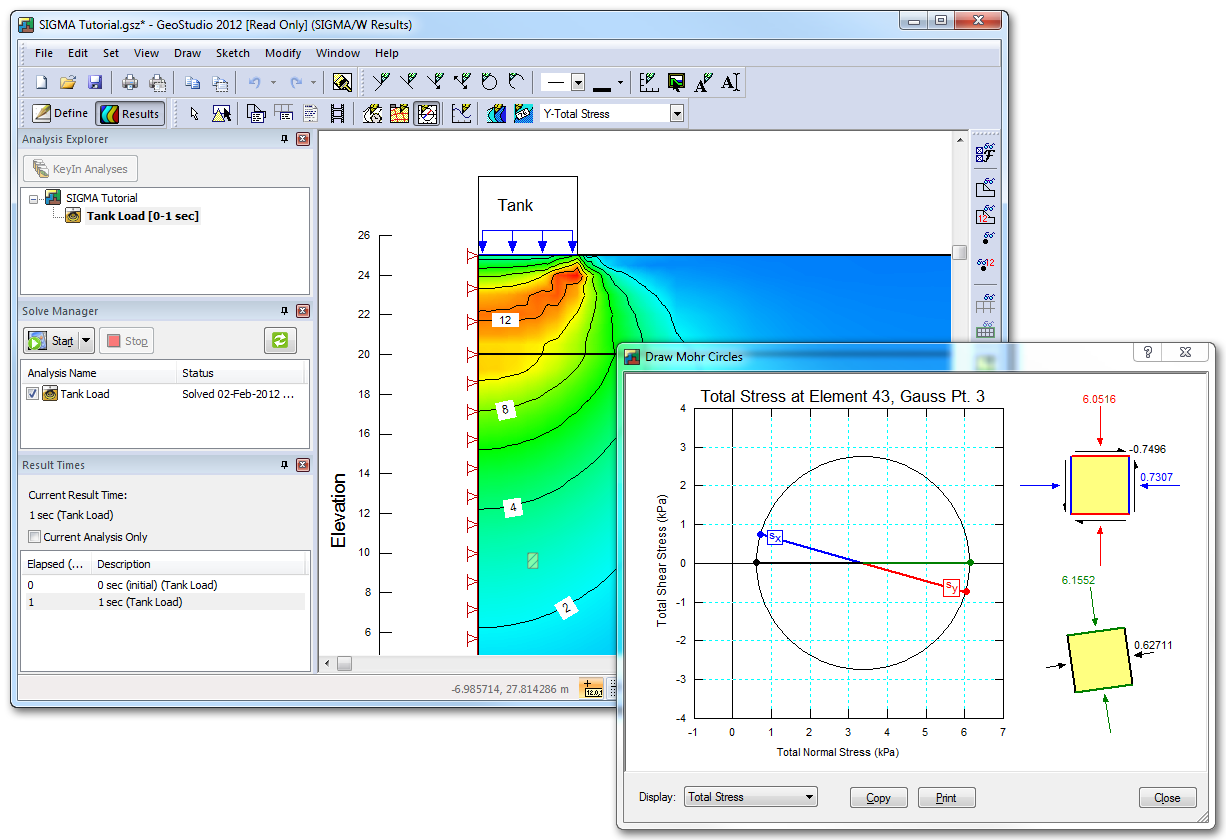
Viewing the Analysis Results
Once you have solved your analysis, SIGMA/W offers many tools for viewing
results. View a deformed mesh or displacement vectors at any magnification.
Generate contours or x-y plots of more than 30 computed parameters, including
deformation, total and effective stress, strain and pore-water pressure. Display
shaded yield zones. View the stress state at any node or element Gauss point as
a Mohr Circle with the associated space-force diagrams. Plot shear or moment
distribution along structural elements. Then prepare the results for your report
by adding labels, axes, and pictures, or export the results into other
applications such as Microsoft® Excel® for further analysis.
<Typical Applications>
SIGMA/W can model almost any stress or
deformation problem, including:
- Settlement of footings, fluid-filled tanks,
or earth structures
- Deformation within or underneath an
embankment or earth dam
Closure around a tunnel
- Lateral movement of braced or anchored
excavations and surface settlement around the excavation
- Floor rebound of open-pit, sloping
excavations
- Volume changes (uncoupled consolidation or
heave) resulting from pore-water pressure changes
- Staged fill placement, earth removal
- Soil-structure interaction, including free
un-bonded anchors, cross excavation struts, and trusses
- Fully-coupled consolidation analysis
- Simulation of tailings deposition
- Permanent deformations resulting from
strength loss
- Strength reduction stability
[QUAKE/W
2012]
dynamic earthquake analysis.
QUAKE/W is a geotechnical finite element CAD software product for the dynamic
analysis of earth structures subjected to earthquake shaking, or point dynamic
forces from a blast or a sudden impact load. QUAKE/W determines the motion and
excess pore-water pressures that arise due to shaking. Its comprehensive
formulation makes QUAKE/W well suited to analyzing a wide range of problems.
Generalized material property functions allow you to use any laboratory or
published data. Three constitutive models are supported: a Linear-Elastic model,
an Equivalent Linear model, and an effective stress Non-Linear model. QUAKE/W
uses the Direct Integration Method to compute the motion and excess pore-water
pressures arising from inertial forces at user-defined time steps.
QUAKE/W can be used to analyze almost any dynamic earthquake problem you will
encounter in your geotechnical, civil, and mining engineering projects.
<Easy to Use>
Defining a Dynamic Earthquake Model
Beginning an analysis is as simple as defining the geometry by drawing regions
and lines that identify soil layers, or by importing a DXF™ file. Then specify
material properties, import earthquake records, and apply boundary conditions
and structural elements.
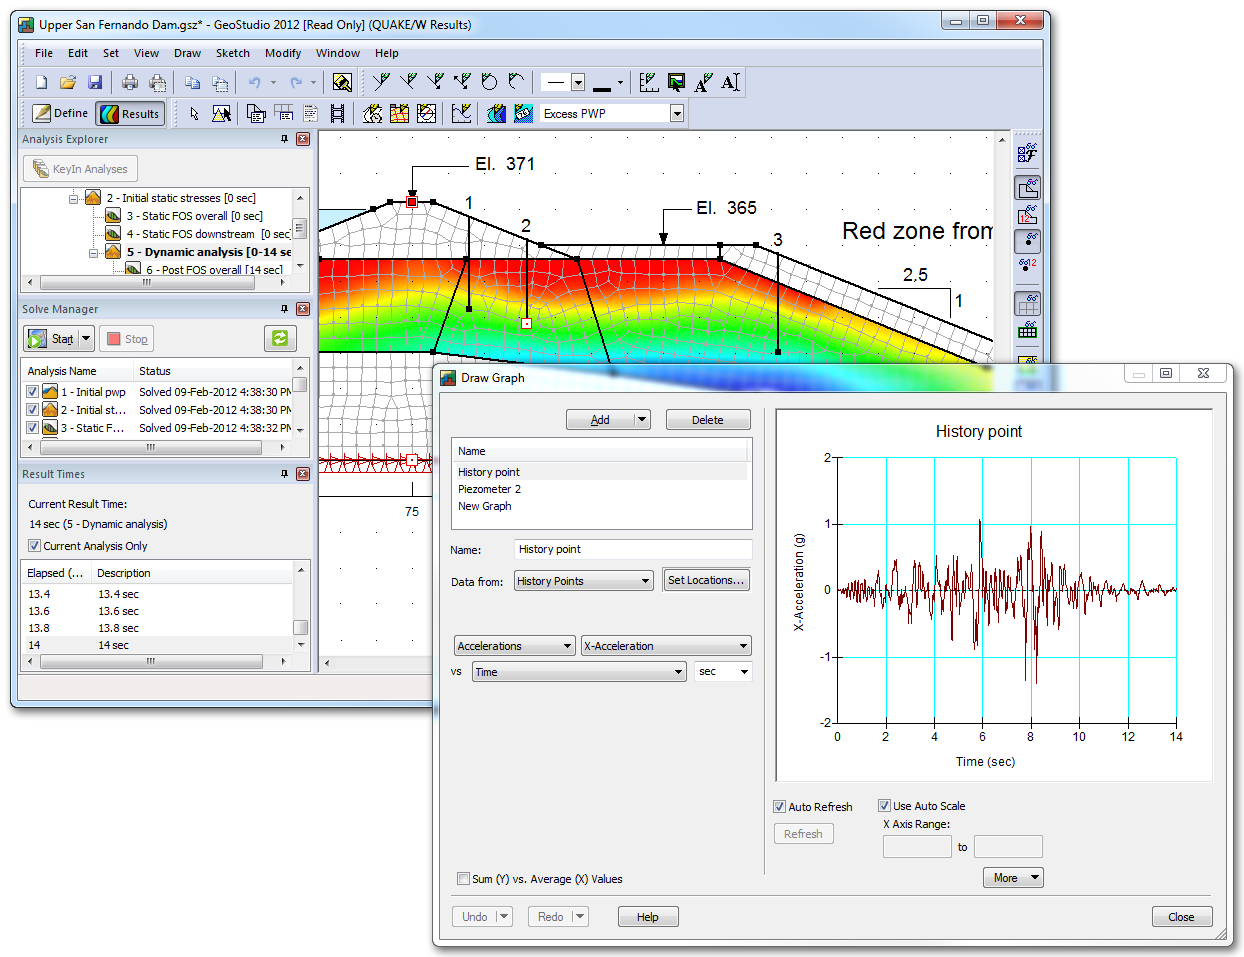
Viewing the Analysis Results
Once you have solved your analysis, QUAKE/W offers many tools for viewing
results. Animate the motion by viewing the displacements for successive steps.
Look at the complete displacement, velocity and acceleration history record at
key points. Perform a spectral analysis at these points to study the ground
motion frequency and seismic characteristics. Generate contours or x-y plots of
stress, strain, pore-water pressure, and over 35 other parameters. Show the
shaded liquefaction zone. View any stress state as a Mohr Circle with the
associated space-force diagrams. Then prepare the results for your report by
adding labels, axes, and pictures, or export the results into other applications
such as Microsoft® Excel® for further analysis.
<Typical Applications>
QUAKE/W can model the dynamic behavior of almost any earth structure,
including:
- Earth embankment dams
- Natural soil and rock slopes
- Loose ground deposits
- Estimation of post-earthquake deformation
- Impact loads from dynamic blasting
- Any natural, near-horizontal ground sites with potential for excess
pore-water pressure
- generation during earthquake shaking
[TEMP/W
2012 ]
thermal analysis.
TEMP/W is a finite element CAD software product for analyzing thermal changes
in the ground due to environmental factors or the construction of facilities
such as buildings or pipelines. The comprehensive formulation makes it possible
to analyze both simple and highly complex geothermal problems. TEMP/W can be
applied to the geothermal analysis and design of geotechnical, civil, and mining
engineering projects, including facilities subjected to freezing and thawing
temperature changes.
TEMP/W is formulated to account for the latent heat associated with water
turning into ice and ice turning into water. The rate at which the latent heat
is absorbed or released is controlled by an unfrozen water content function.
Above the phase change temperature, all the water is unfrozen. As the
temperature falls below the phase change point, the portion of the water that
remains unfrozen decreases. Complete flexibility in defining the unfrozen water
content function makes it possible to analyze a wide variety of ground
conditions. When linked with SEEP/W or AIR/W it can consider convective heat
transfer caysed by flowing water or moving air.
<Easy to Use>
Defining a Geothermal Model
Beginning an analysis is as simple as defining the geometry by drawing regions
and lines that identify soil layers, or by importing a DXF™ file. Then
graphically apply boundary conditions and specify material properties. Boundary
conditions can be automatically created from imported climate data, thermosyphon
properties, or convective surface data.
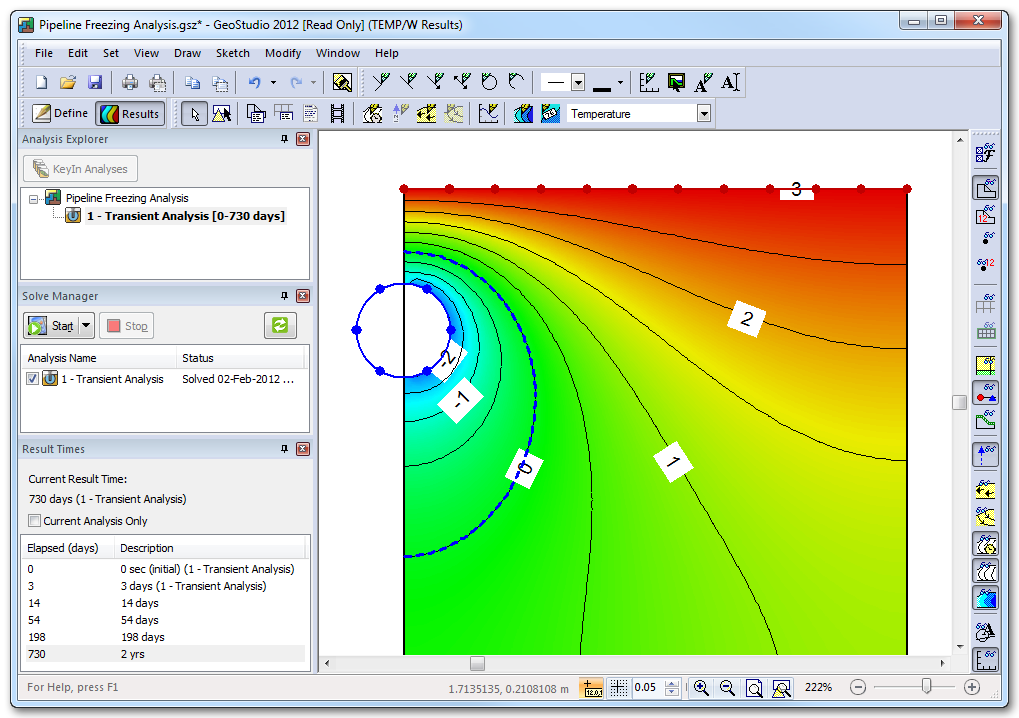
Viewing the Analysis Results
Once you have solved your geothermal analysis, TEMP/W offers many tools for
viewing results. Generate contours or x-y plots of any computed parameter, such
as temperature, flux, gradient, latent heat, or net radiation. Gradient vectors
show the energy flow direction and rate. Transient conditions can be shown by
plotting the changing frost front position over time. View energy flow paths and
flux quantities. Interactively query computed values by clicking on any node,
element Gauss region, or flux section. Then prepare the results for your report
by adding labels, axes, and pictures, or export the results into other
applications such as Microsoft® Excel® for further analysis.
<Typical Applications>
TEMP/W can model almost any geothermal problem, including:
- Degradation of permafrost beneath warm buildings or around a warm,
buried pipeline
- Development of a frost bulb around a chilled pipeline
- Ground freezing for soil stabilization, including use of freezing pipes
around mine shafts or thermosyphons on top of earth dams
- Freeze-thaw action beneath roadways and airport runways
- Frost depth penetration beneath chilled structures such as a
recreational ice surface or a highway during winter
- Effectiveness of various insulation alternatives for reducing freezing
and/or thawing
[CTRAN/W
2012]
contaminant transport analysis
CTRAN/W is a finite element CAD software product that can be used to model the
movement of contaminants through porous materials such as soil and rock. The
comprehensive formulation of CTRAN/W makes it possible to analyze problems
varying from simple particle tracking in response to the movement of water, to
complex processes involving diffusion, dispersion, adsorption, radioactive decay
and density dependencies. CTRAN/W can be applied to the analysis and design of
geotechnical, civil, hydrogeological, and mining engineering projects.
CTRAN/W is designed to be used in tandem with a seepage analysis such as SEEP/W
to analyze contaminant transport. SEEP/W computes the water flow velocity,
volumetric water content, and water flux; CTRAN/W uses these parameters to
compute the contaminant migration.
<Easy to Use>
Defining a Contaminant Transport Model
Once you have solved your flow problem with SEEP/W or VADOSE/W, you can use
the graphical tools in CTRAN/W to interactively apply boundary conditions and
specify material properties. Conduct a simple particle tracking analysis, or
define dispersivity, diffusion, adsorption, decay and density to conduct an
advection-dispersion analysis.
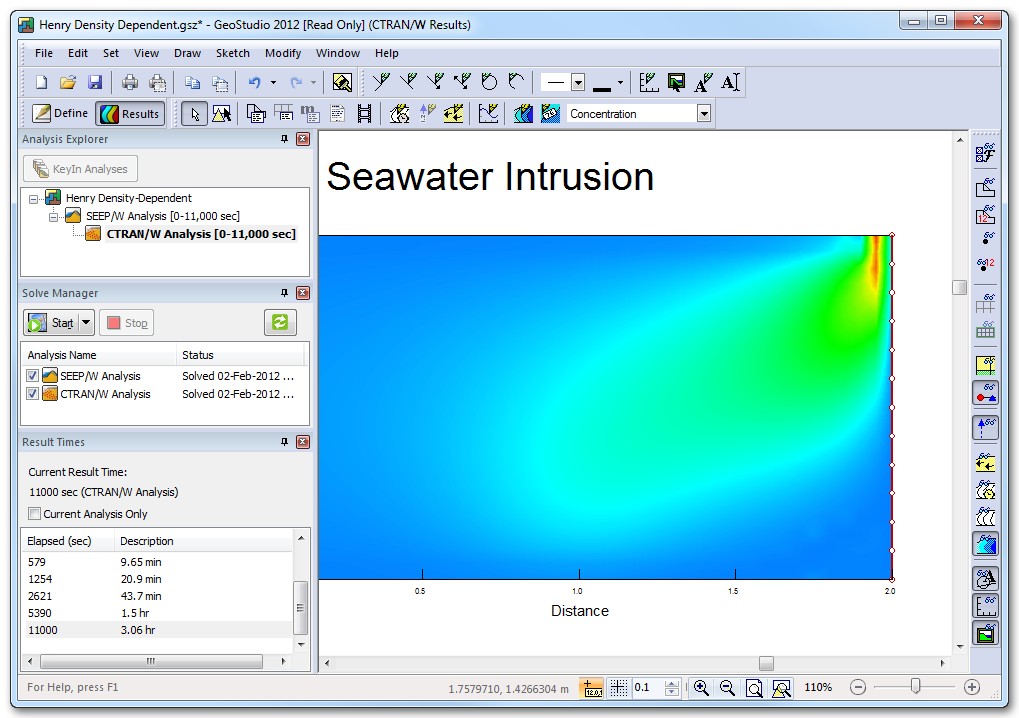
Viewing the Analysis Results
After solving your contaminant transport problem, CTRAN/W offers many tools for
viewing results. Generate contours or x-y plots of any computed parameter, such
as concentration, mass, adsorption, dispersion, or Peclet and Courant numbers.
Velocity vectors show the flow direction and rate. Examine the contaminant mass
in the solid and liquid phases at any location. Transient conditions can be
shown by plotting the changing concentration levels over time. Interactively
query computed values by clicking on any node, element Gauss region, or flux
section. Then prepare the results for your report by adding labels, axes, and
pictures, or export the results into other applications such as Microsoft®
Excel® for further analysis.
<Typical Applications>
CTRAN/W can model almost any contaminant transport problem, including:
-
Flow of contaminants from a surface pond
-
Flow of dissolved hydrocarbons
-
Flow of radioactive contaminants
-
Transport through fractured rock
-
Sea-water intrusion into coastal aquifers
-
Brine transport
-
Landfill leachate migration


